Extremists on Both Sides
An interactive, data-driven exploration of political extremism in Israel, created in collaboration with The Seventh Eye, an investigative journal. The project compares the frequency and severity of extreme political actions across Israel’s two opposing political camps.
Interactive data visualization, developed under the guidance of Mushon Zer-Aviv.
Read the Portfolio magazine article
The phrase “extremists on both sides” reflects a tendency to portray Israel’s political camps as equally extreme. But how similar are the two sides in their extremism? Does the symmetry implied by the phrase hold up in reality?
There are many ways to compare political extremism: by focusing on politicians or citizens, or by examining statements, actions, goals, or media coverage. Working through these possibilities, I defined a goal and a method:
Goal: To examine whether the symmetry attributed to Israel’s political camps reflects reality.
Method: To compare extreme political actions by the two camps and use data to show the differences that emerge.
“Extremists on Both Sides”
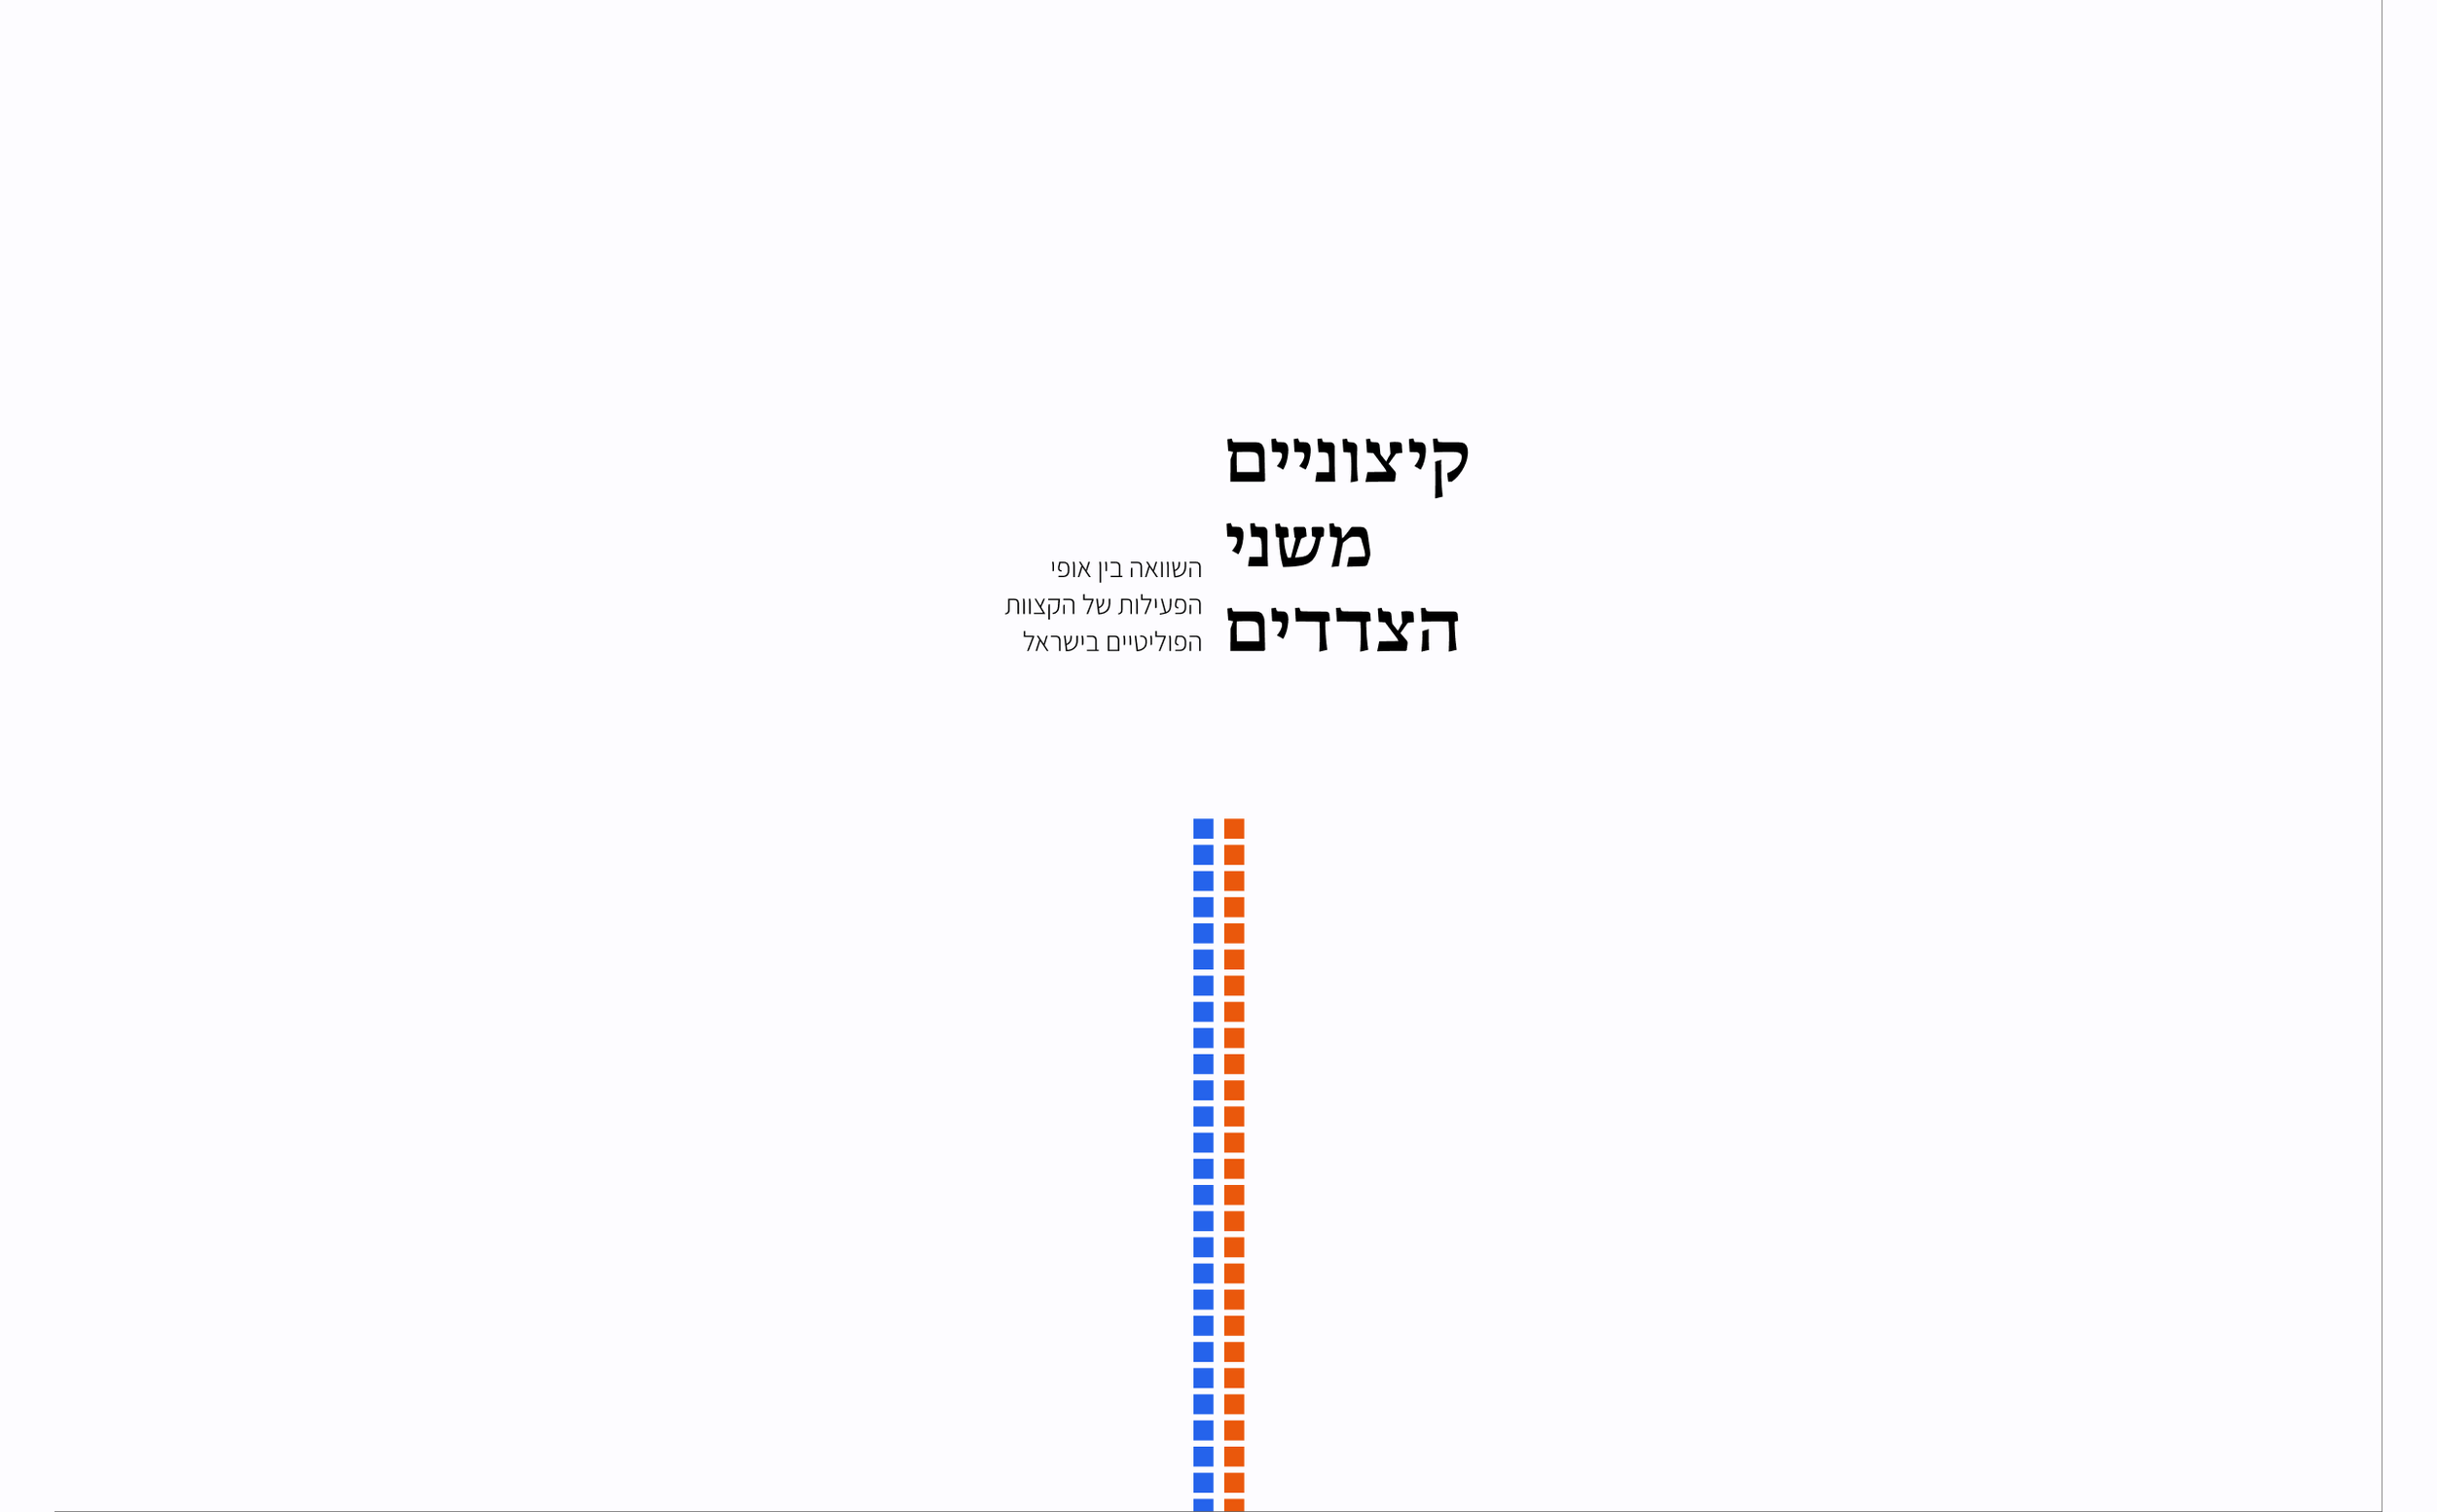
The project’s title guided many of my design and content decisions. Throughout the experience, a central divider splits the screen into two equal sides. Working with The Seventh Eye, we refined every word so that the text would describe the groups and their actions without telling readers how to judge them. The white background is intended to create a neutral, restrained atmosphere.
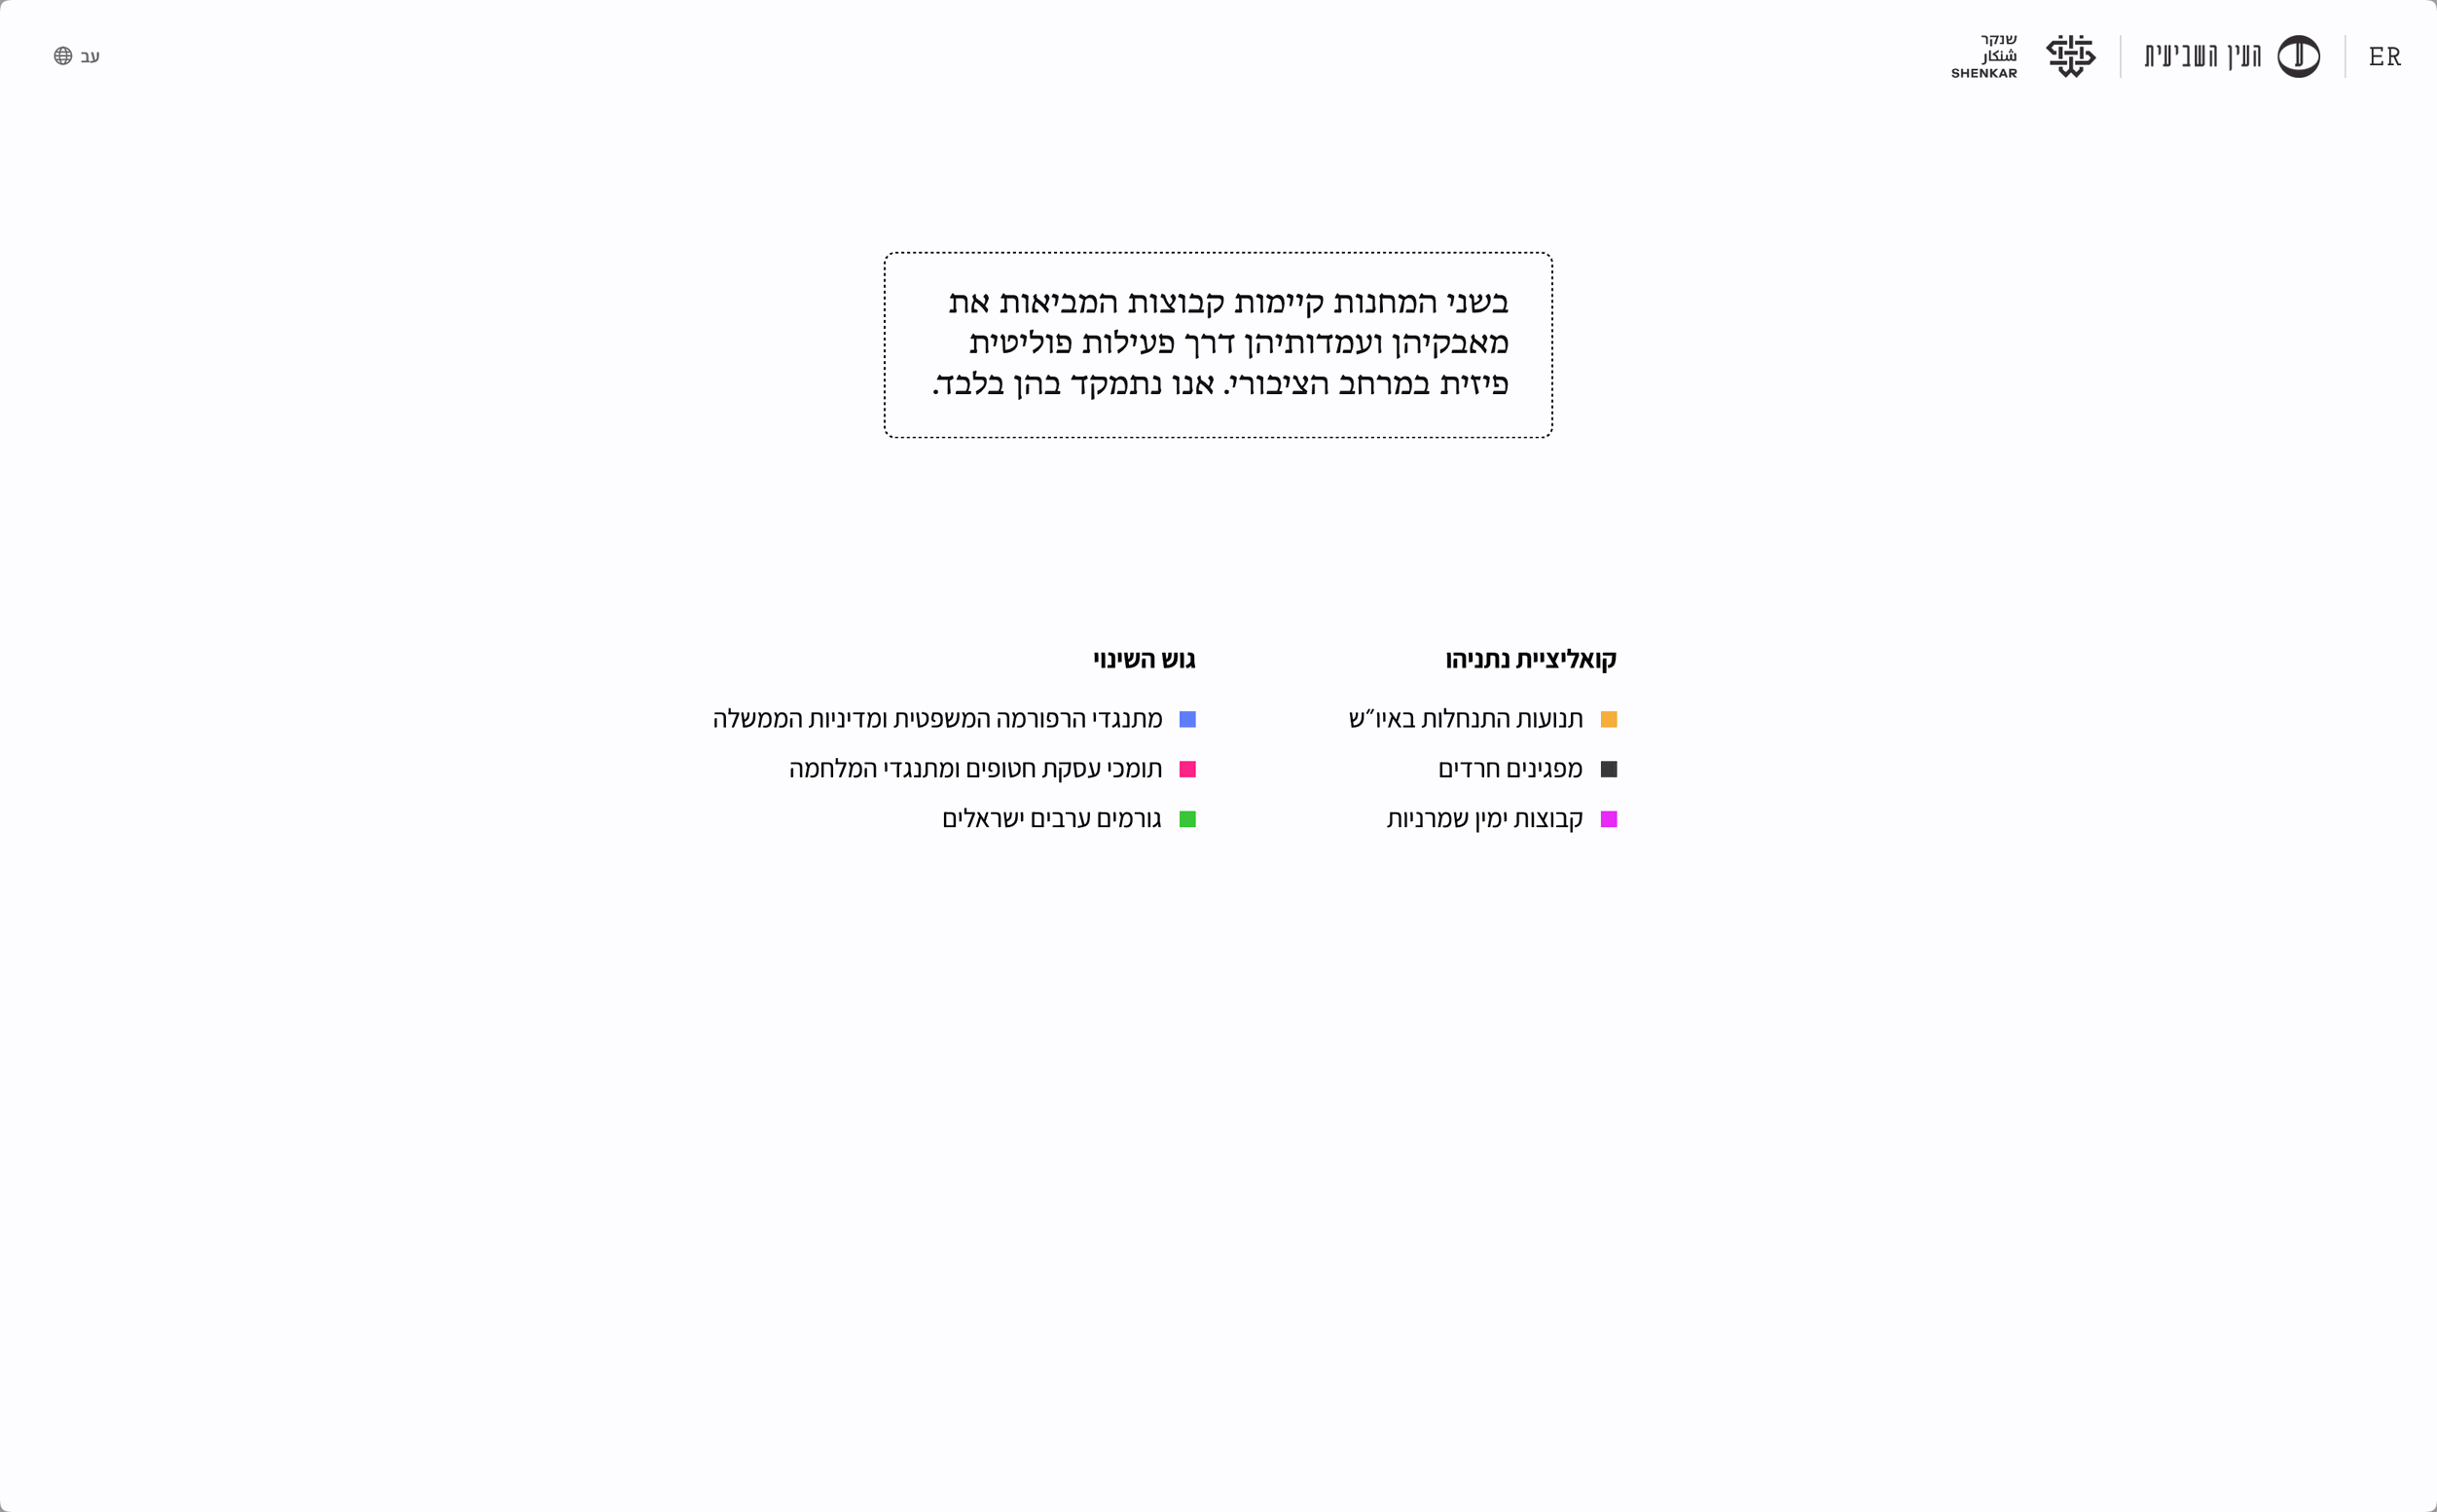
The narrative moves from the macro to the micro: from political camps to the groups within them, and then to their actions. The colored squares, representing political groups, split into two camps: Netanyahu’s coalition and the Change Bloc. I chose not to use the terms “the left” and “the right” because I don’t think they reflect today’s political reality. Still, the camps’ positions on the screen still hint at those labels. Choosing the right terms and concepts was an ongoing part of the process. Working with The Seventh Eye, Mushon, Oren, and I refined every word so that the text would describe the groups and their actions without telling readers how to judge them.
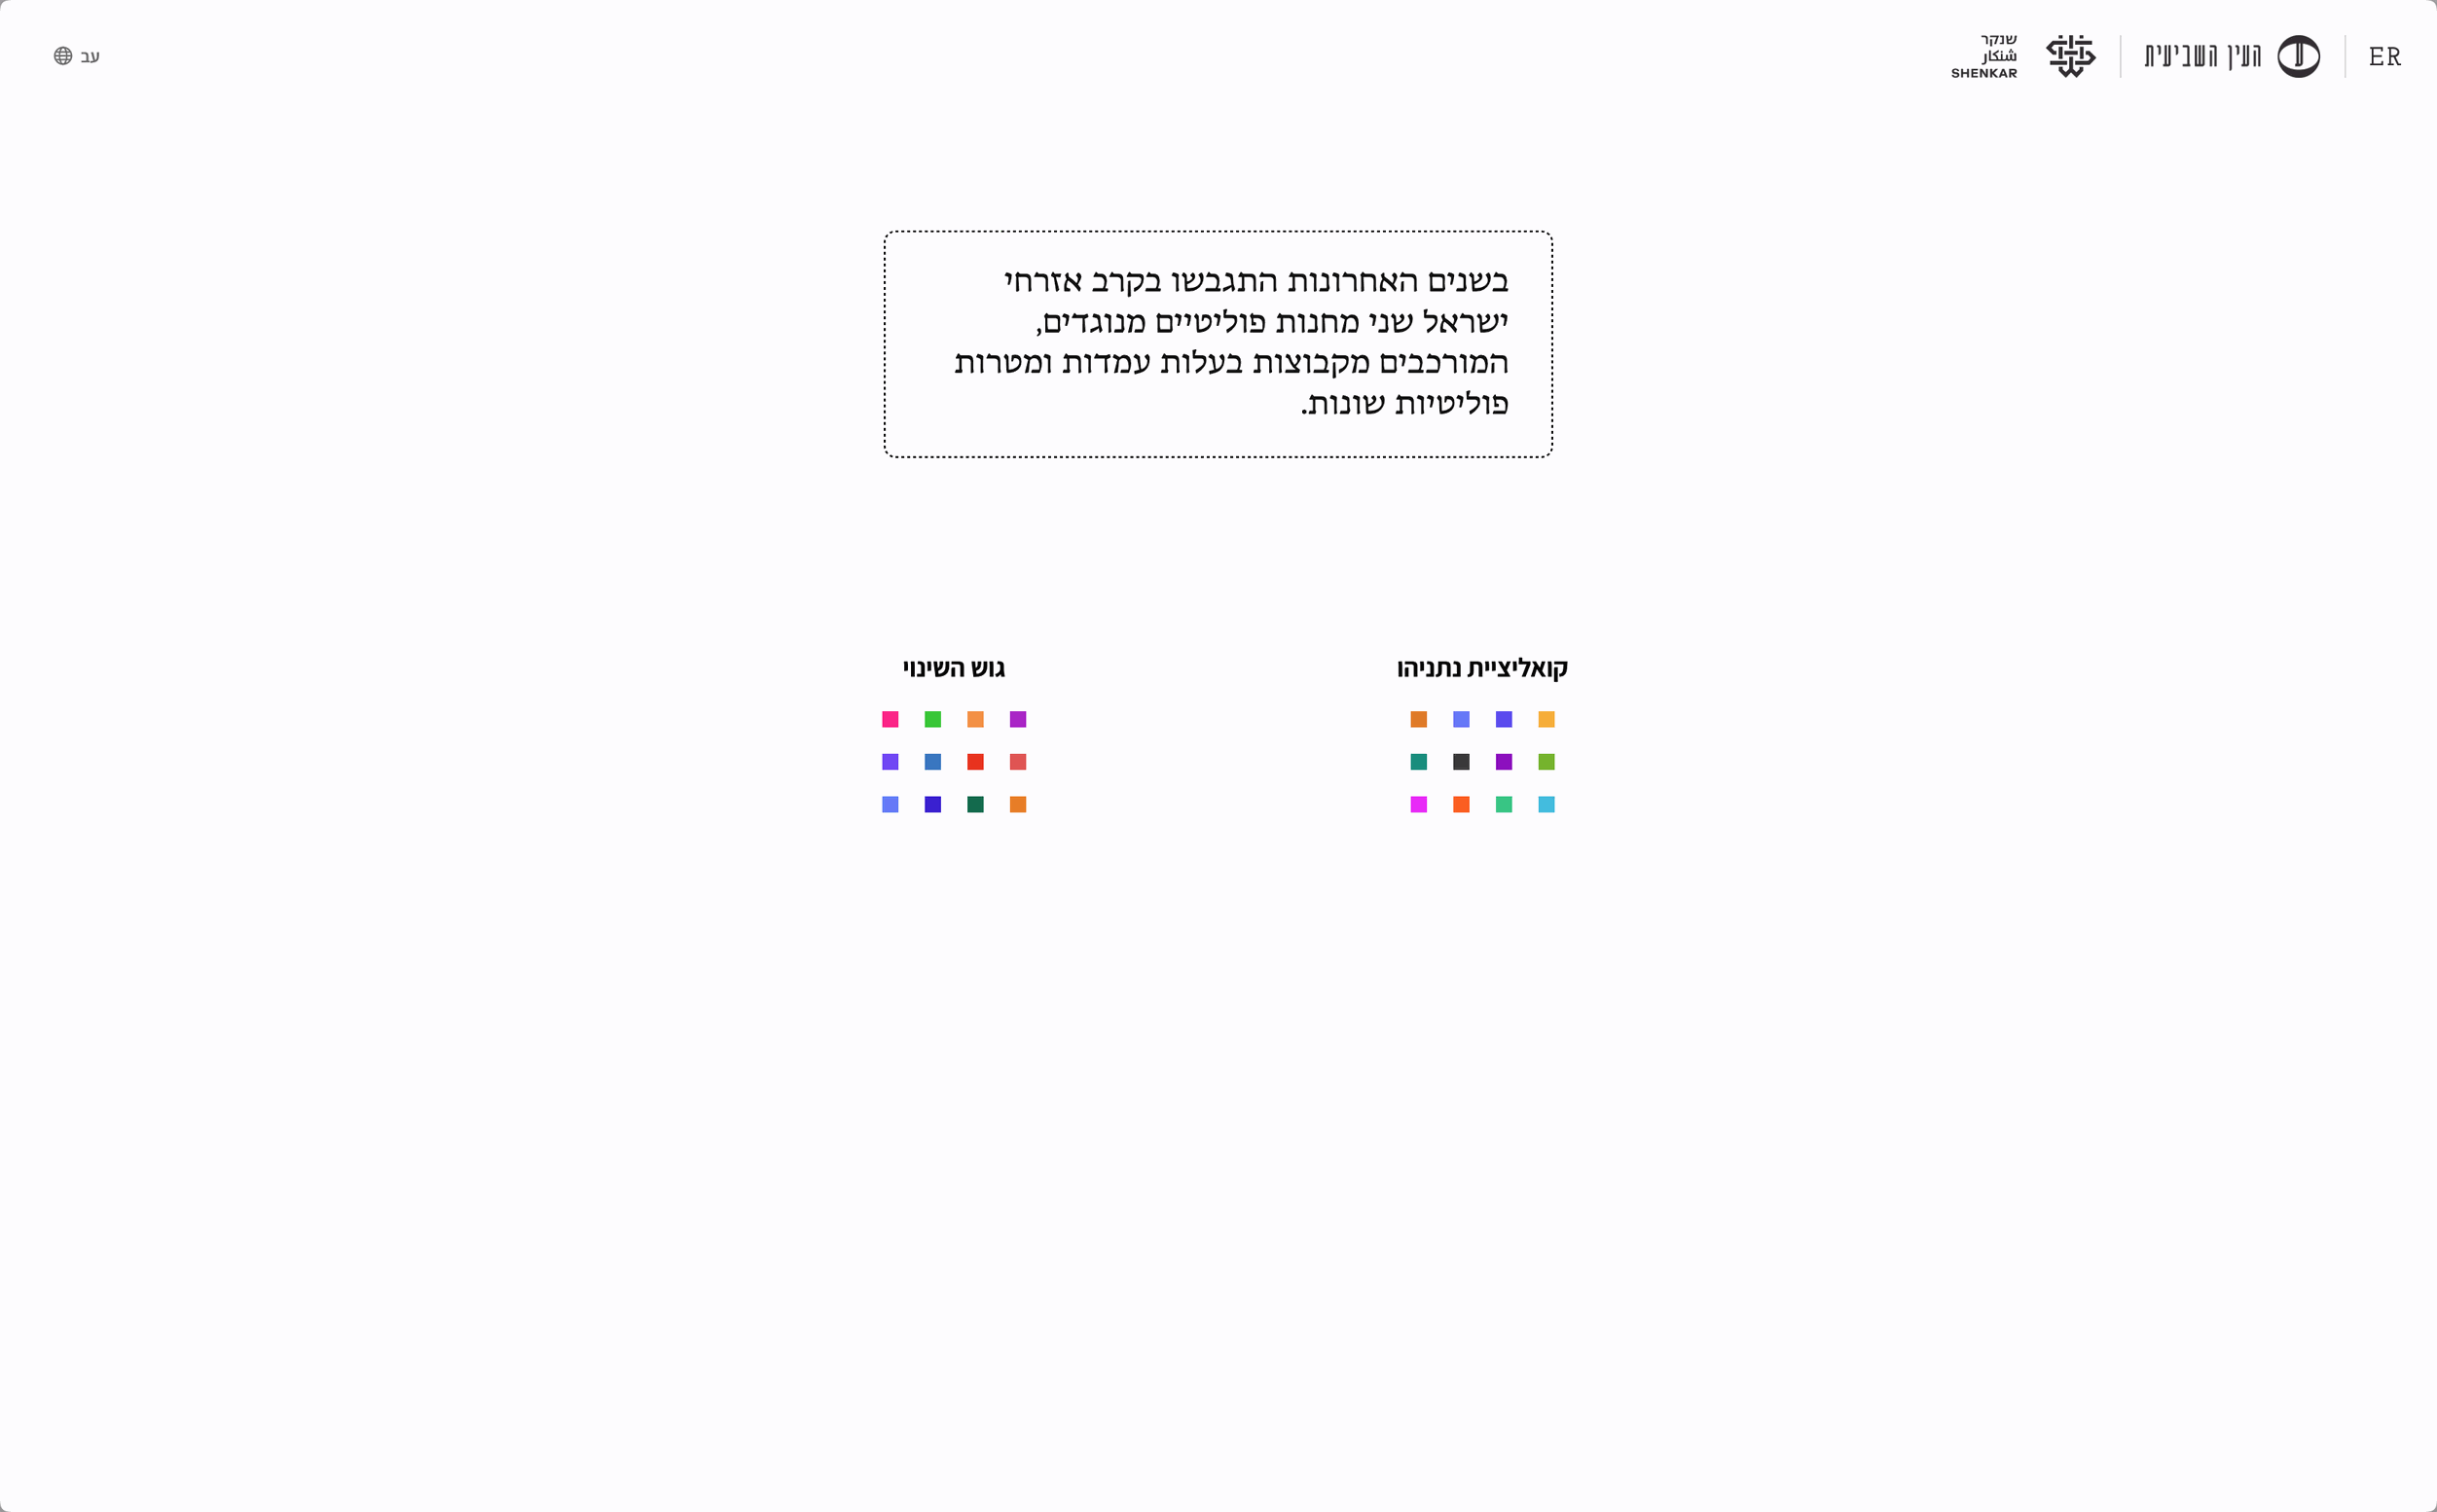
Once the camps are established on either side of the screen, the project introduces the groups it focuses on and explains why they were chosen. Each group is assigned its own color. The colors have a similar intensity to avoid emphasizing any particular group or creating a hierarchy. Some were chosen for their political or social associations: orange for settlers, following the protests against the disengagement plan, and black for ultra-Orthodox Jews, because of their traditional clothing. Others were chosen for visual clarity and usability.
When selecting the groups to compare, I asked myself: “When people say ‘extremists on both sides,’ who do they mean?” In naming the groups, I tried to avoid generalizing about entire populations, such as settlers, Arabs, or ultra-Orthodox Jews, and instead identify the politically active groups within them.
Moving the groups to the sides of the screen turns them into a prominent, accessible legend. At the same time, their movement from the center to the edges echoes the idea of political extremes and illustrates the accompanying text.
Patterns of Action
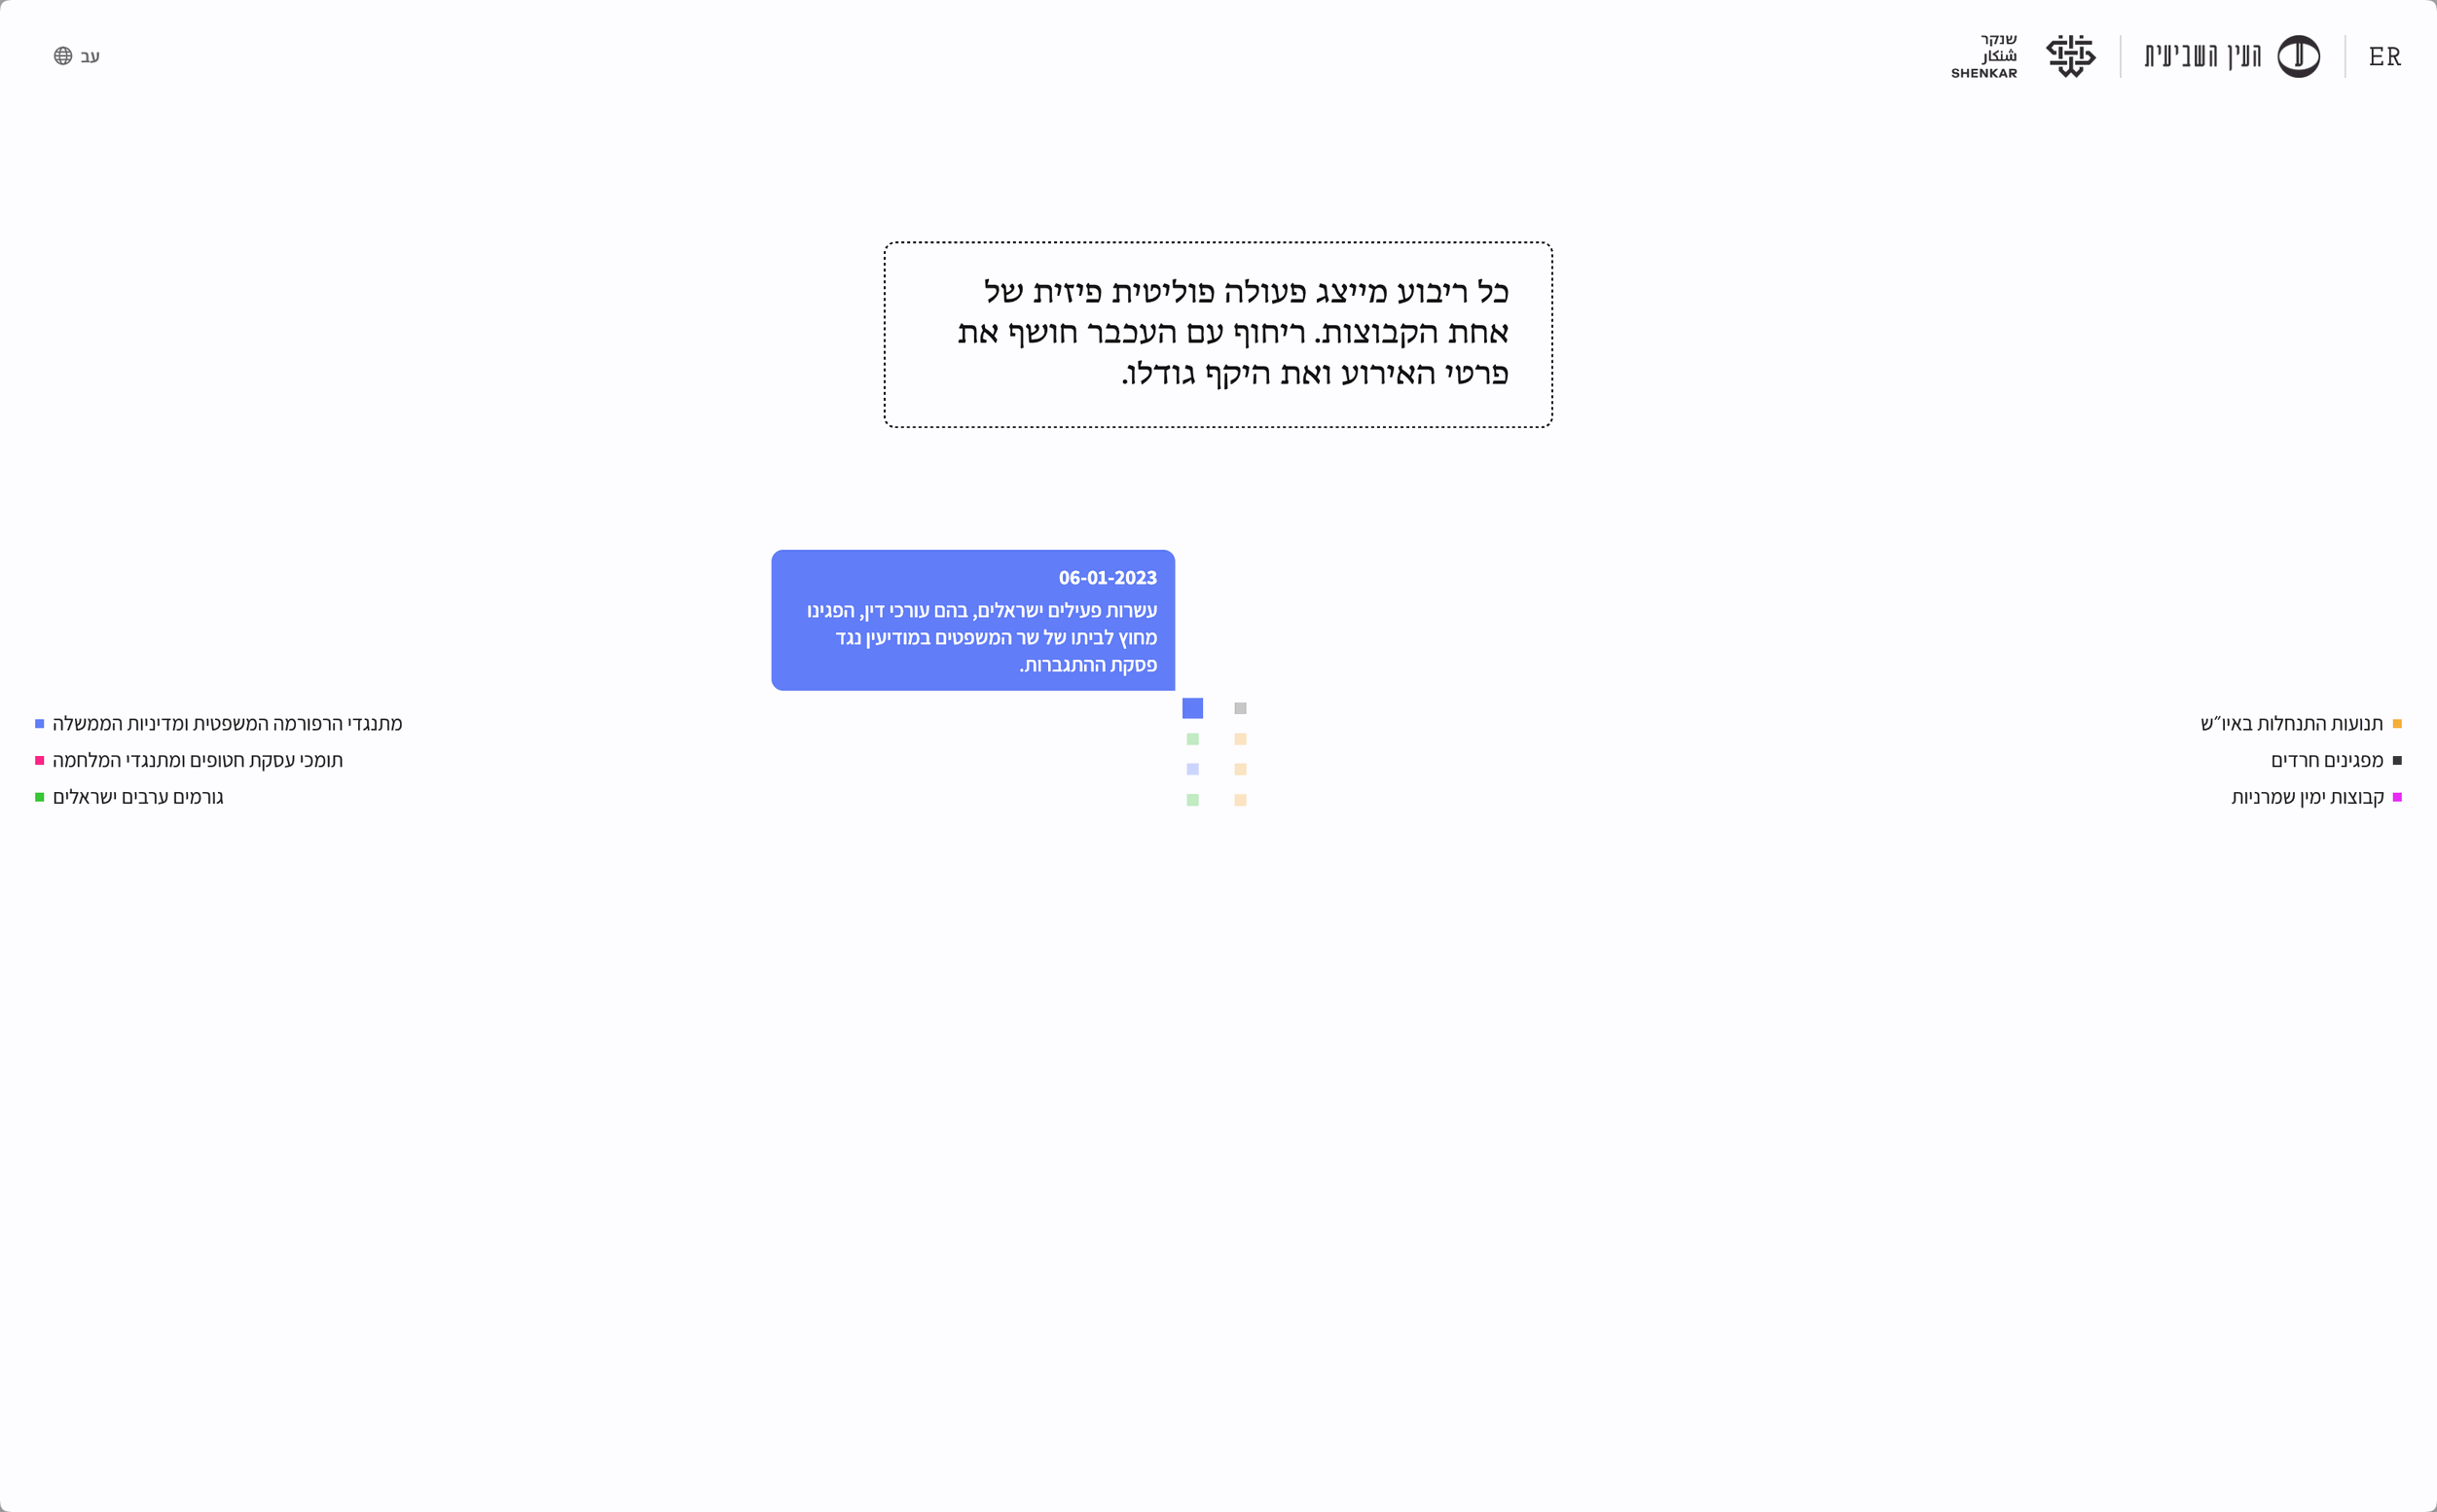
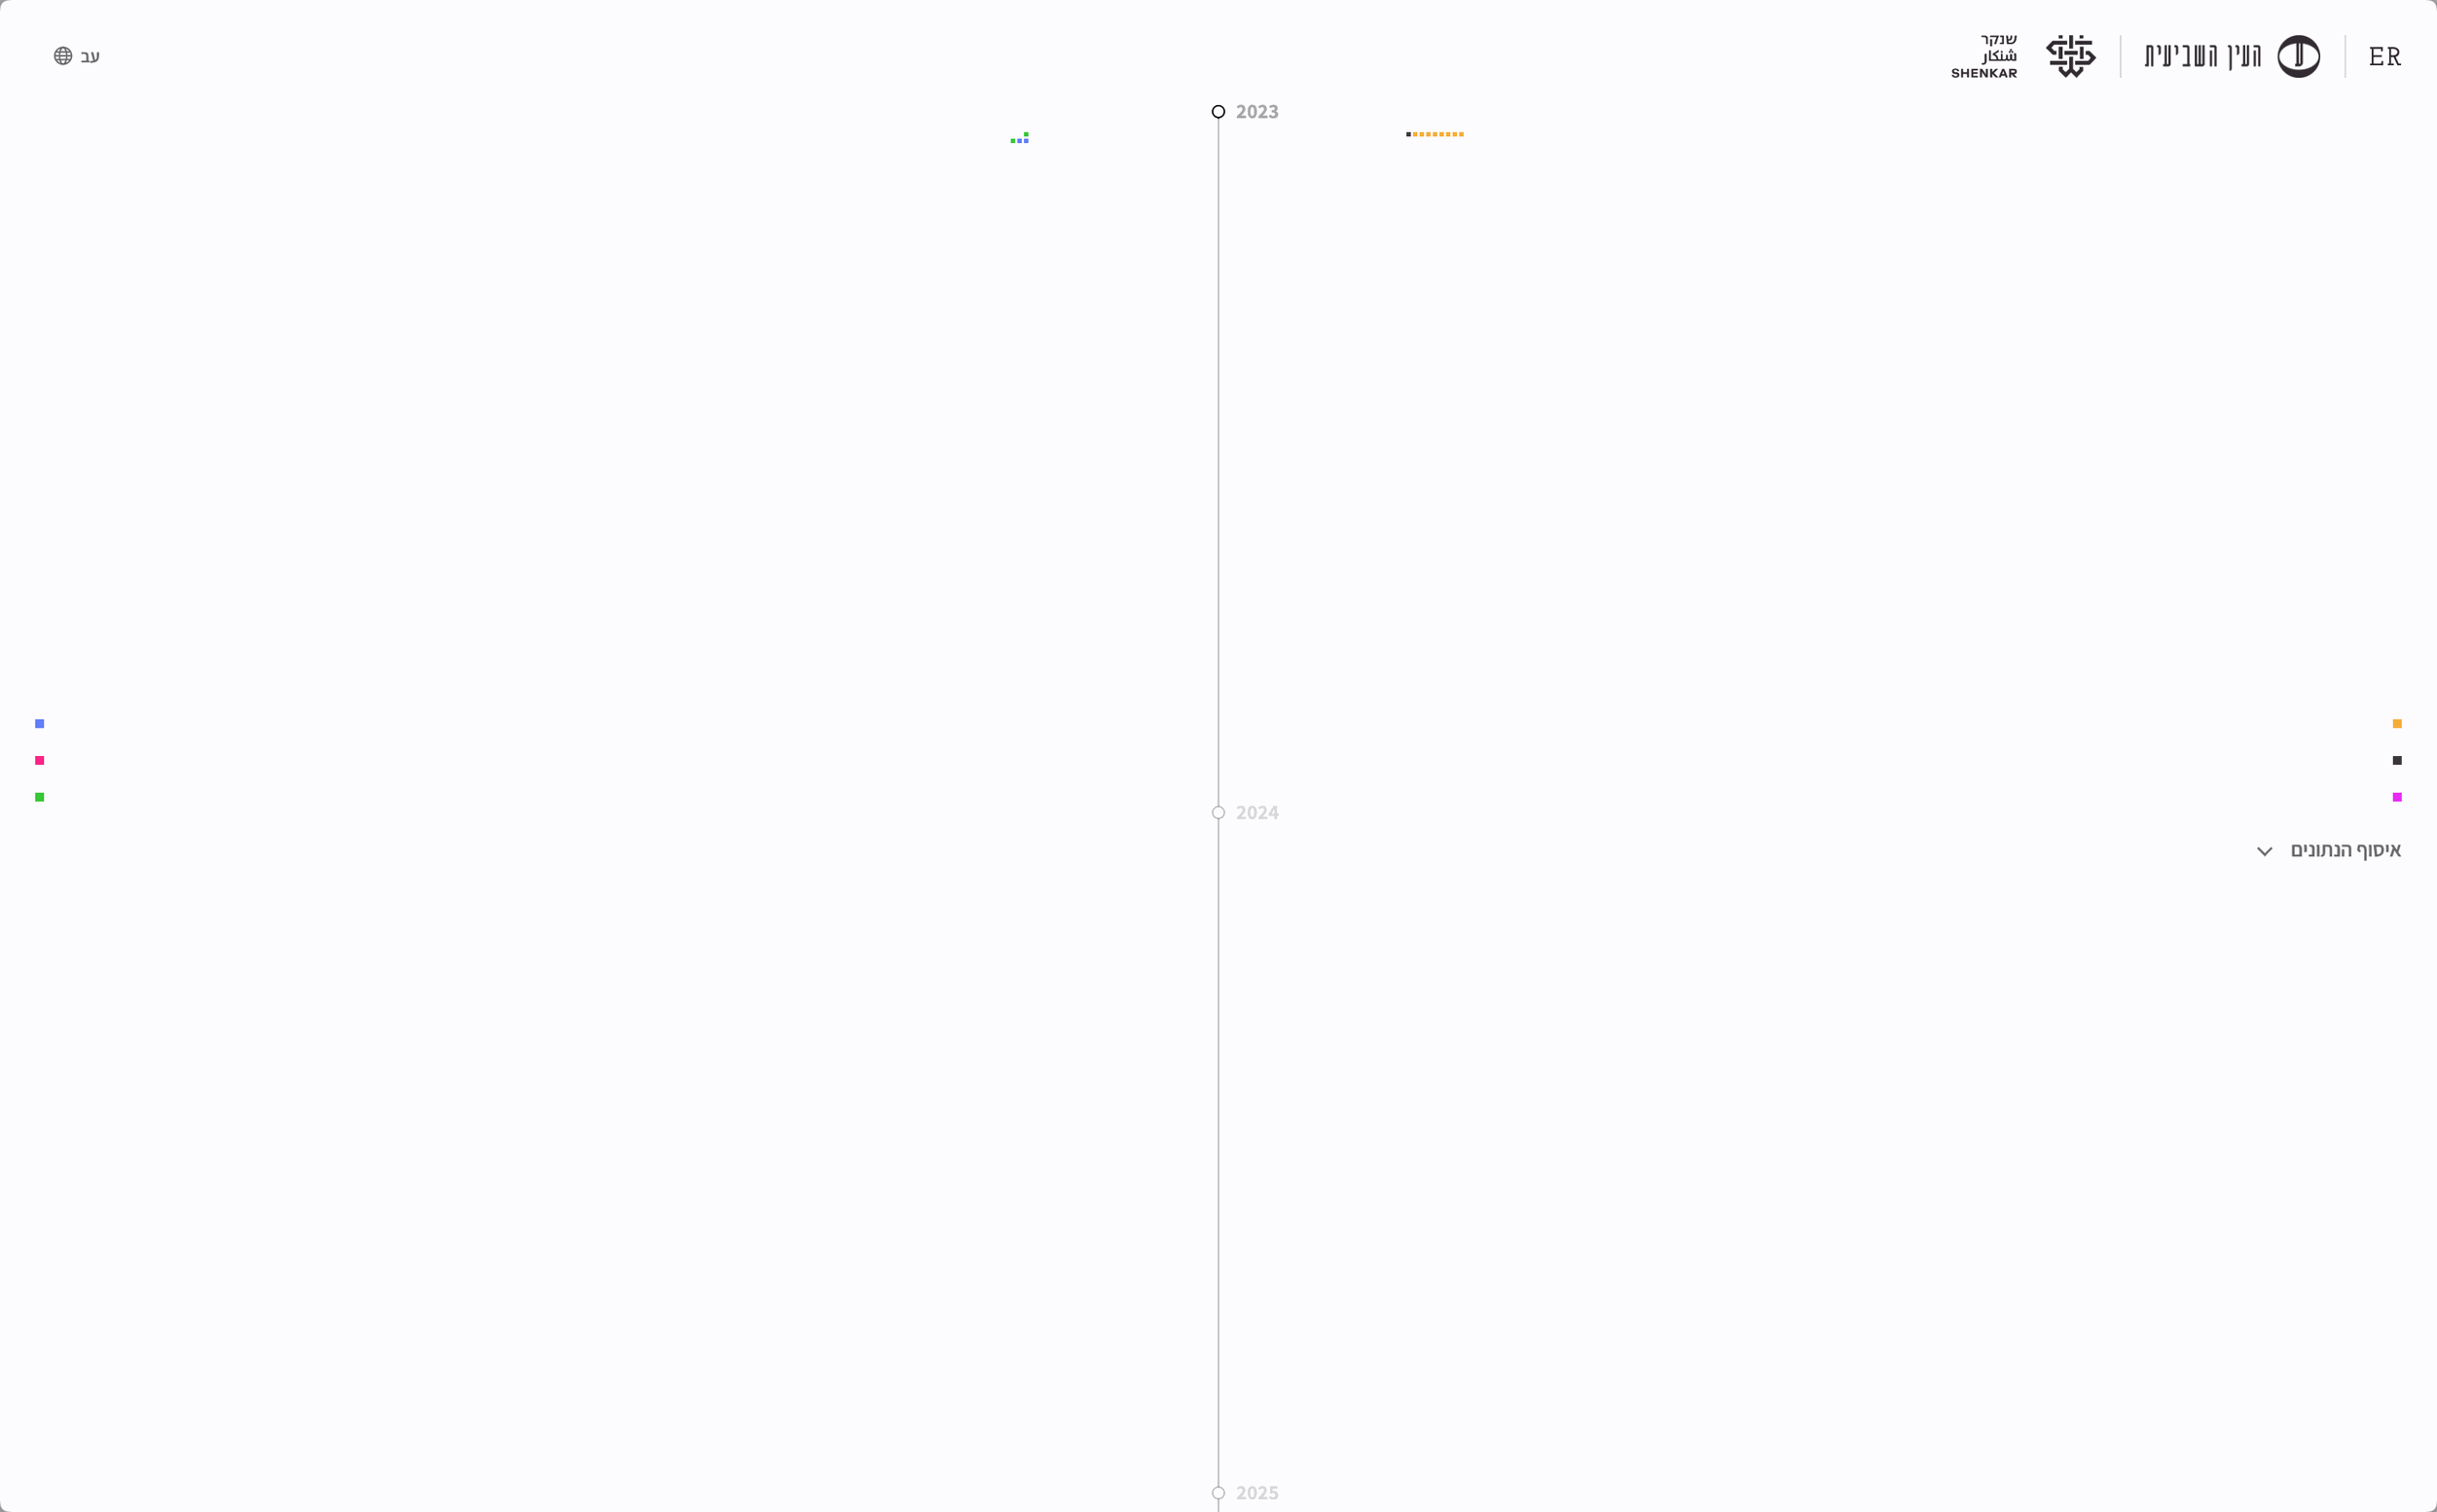
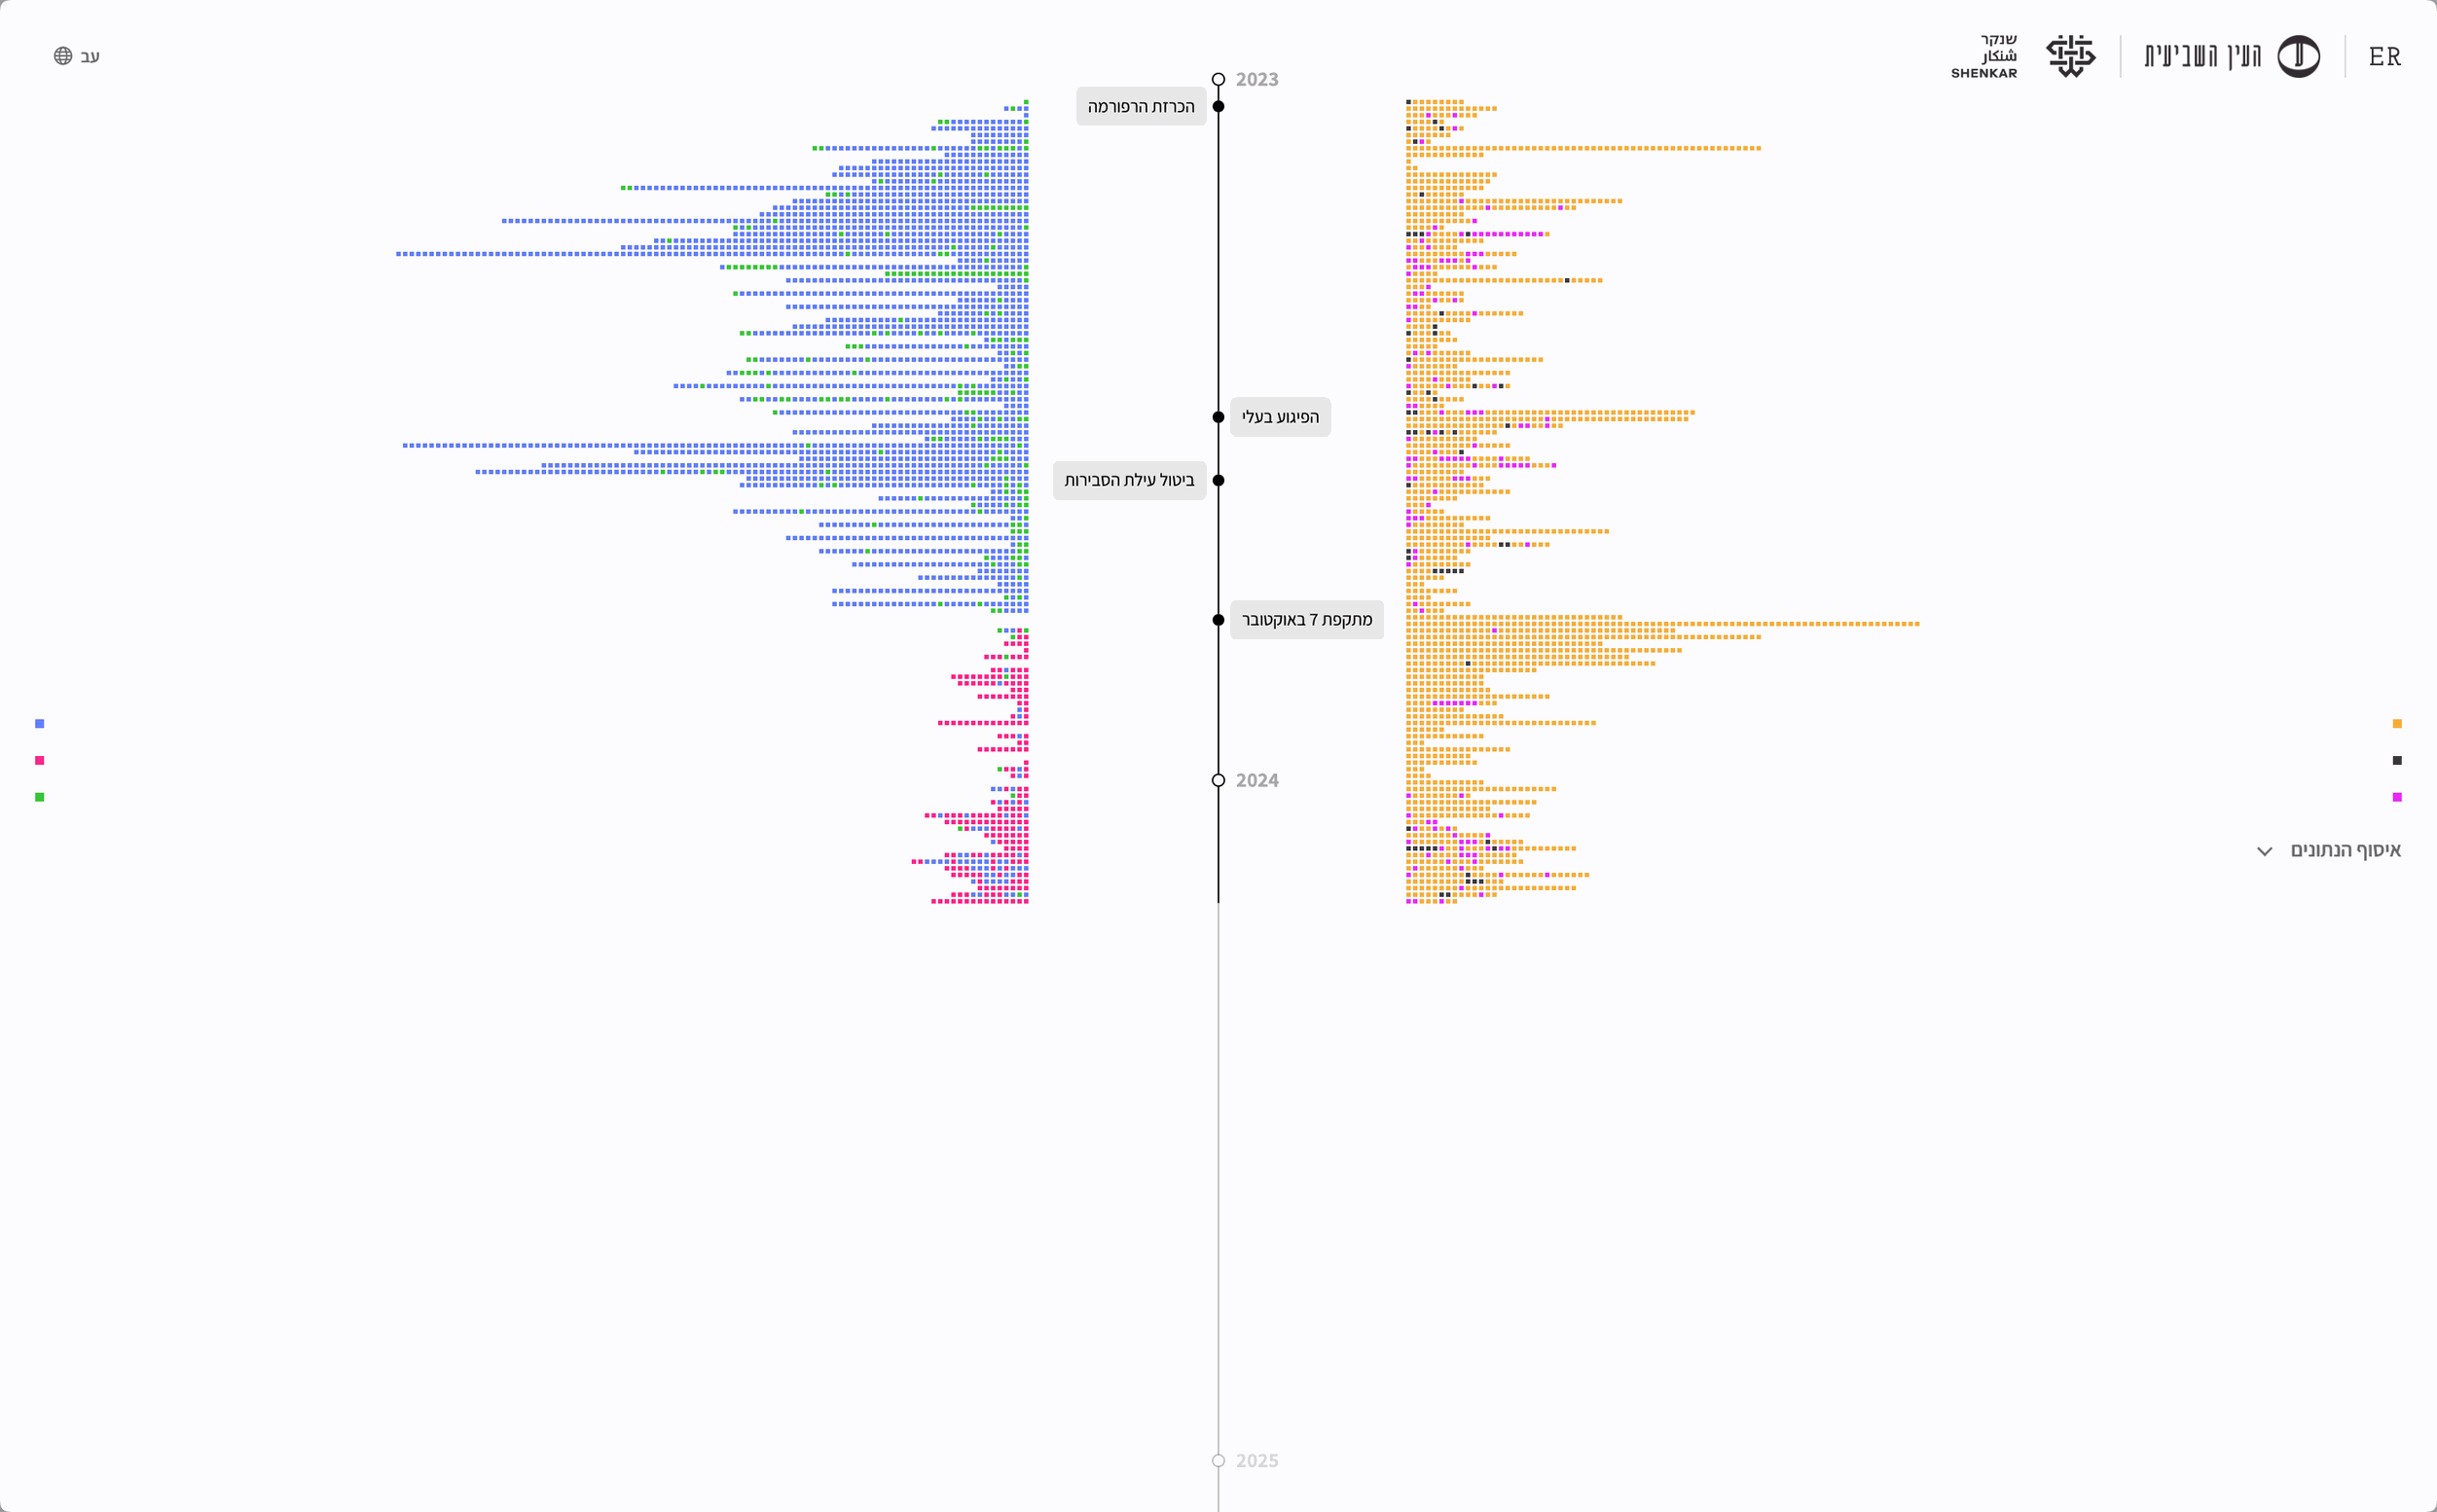
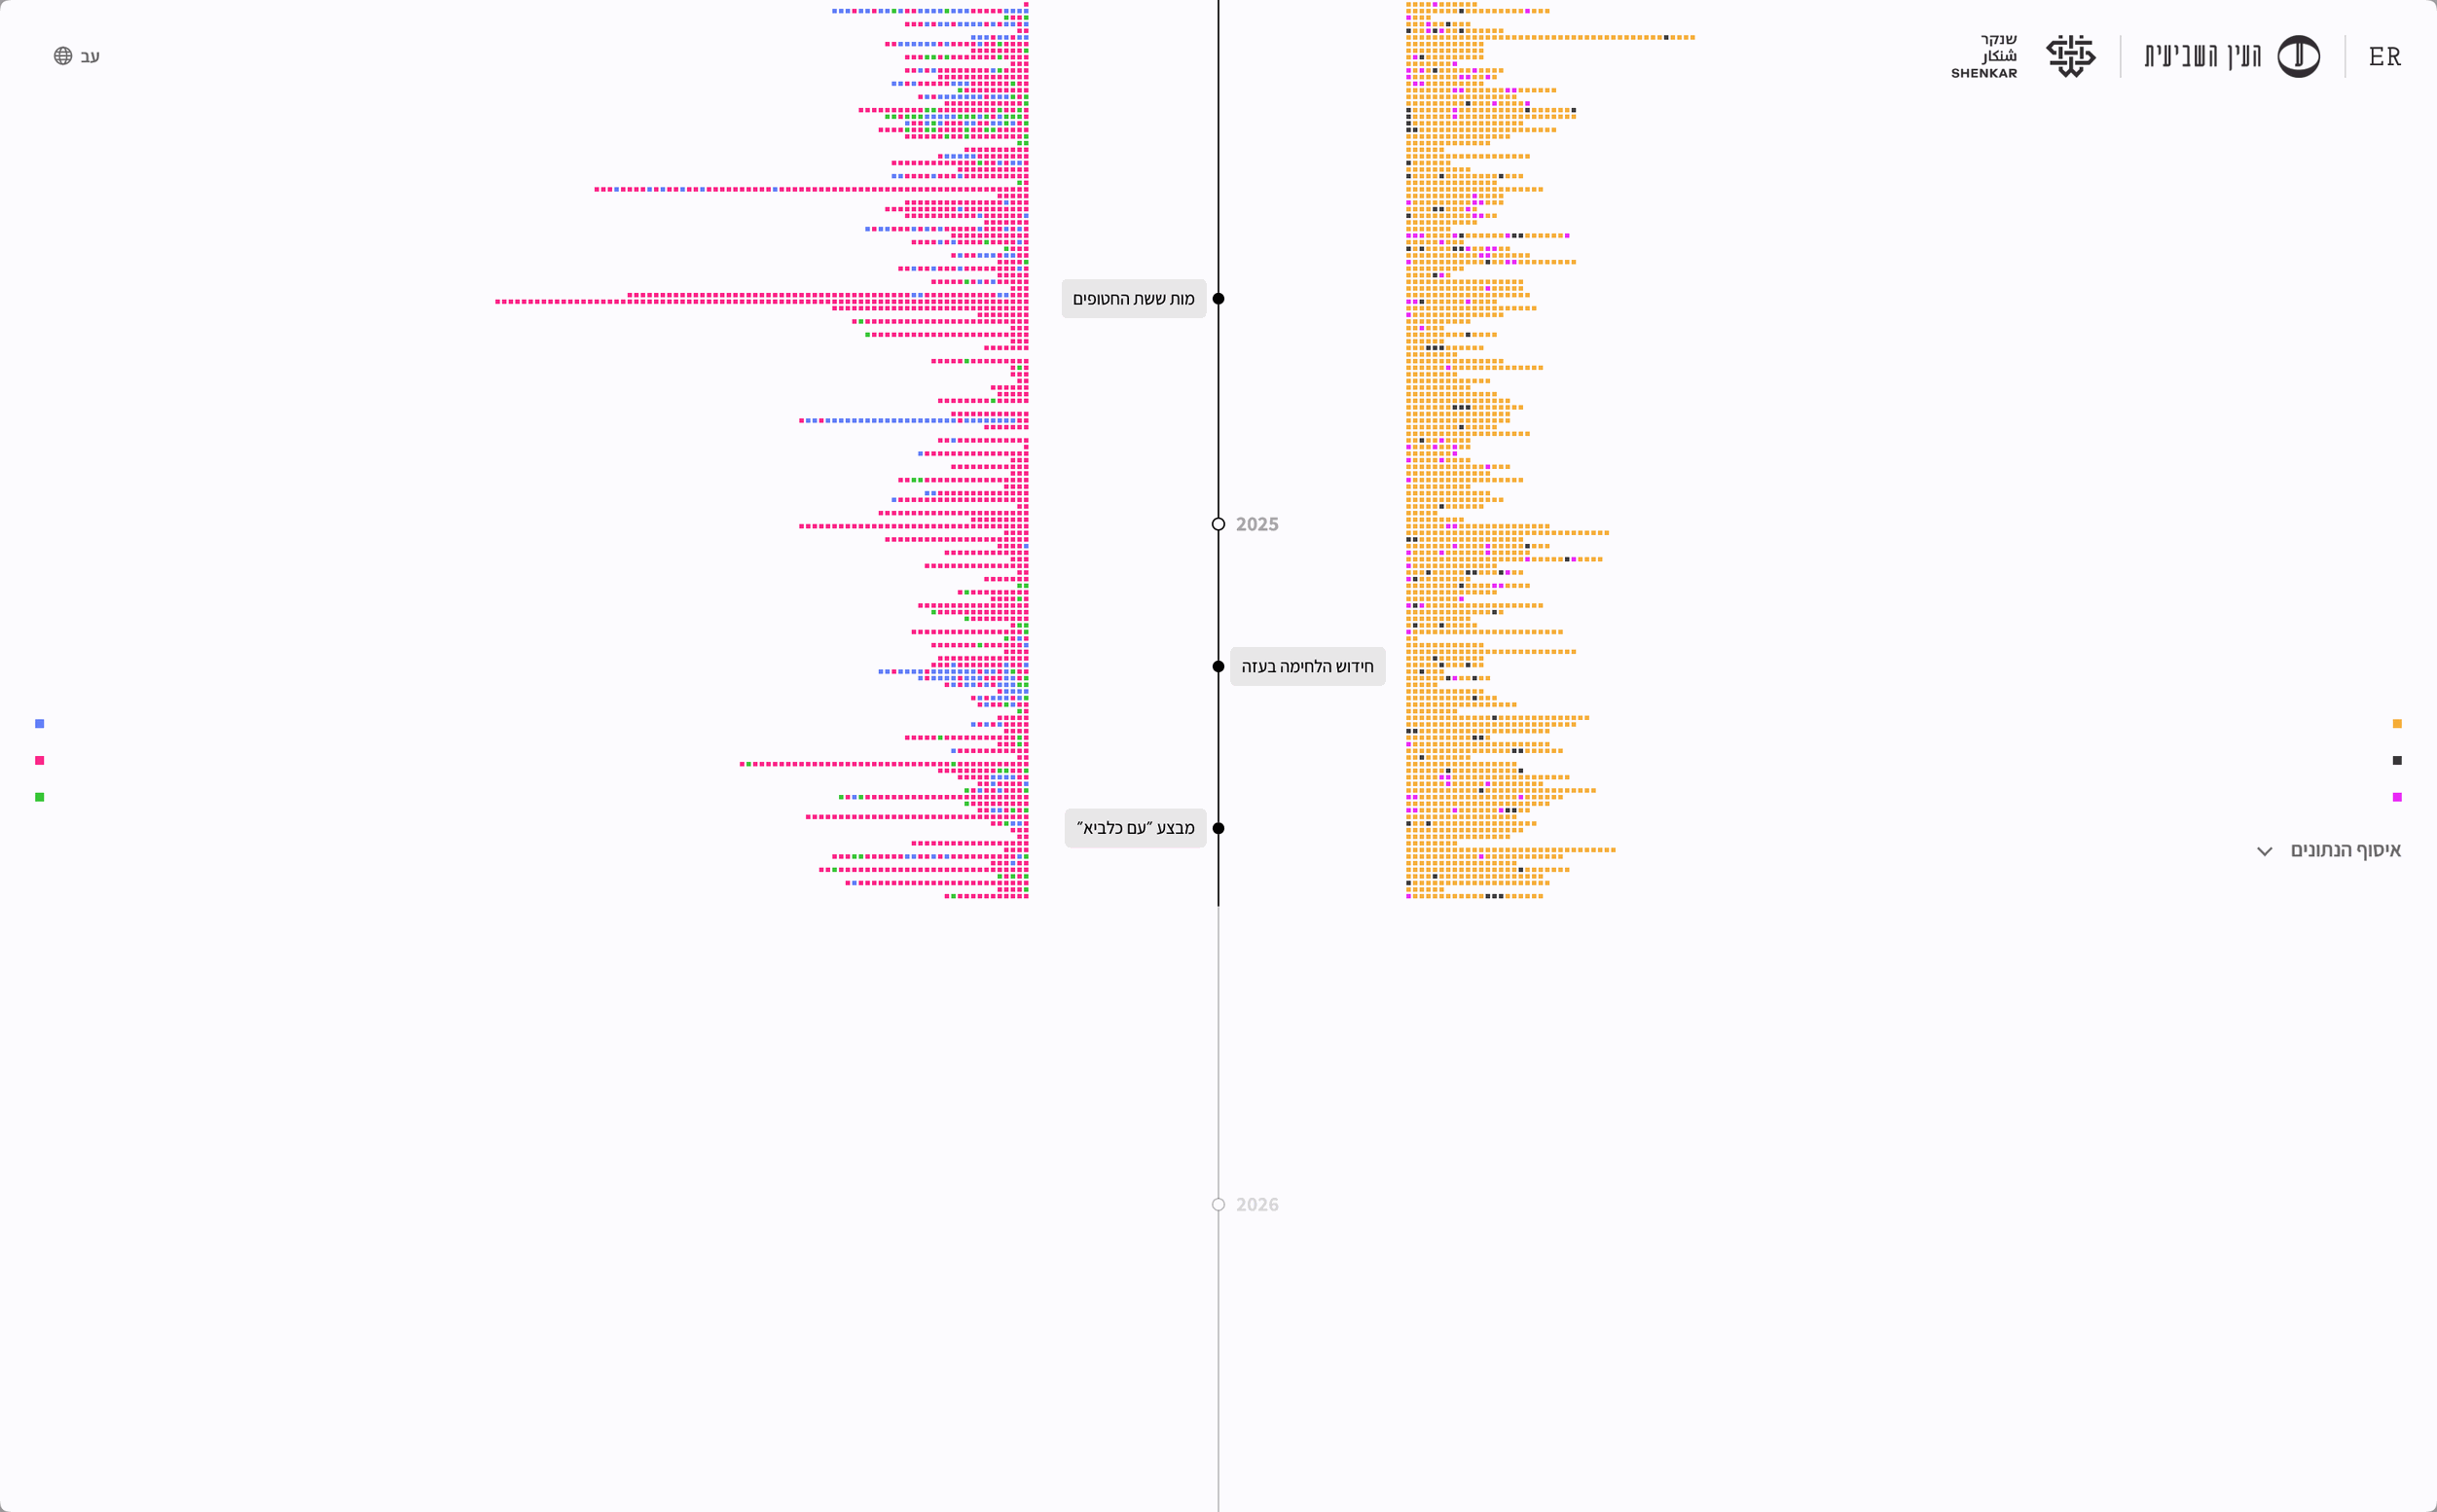
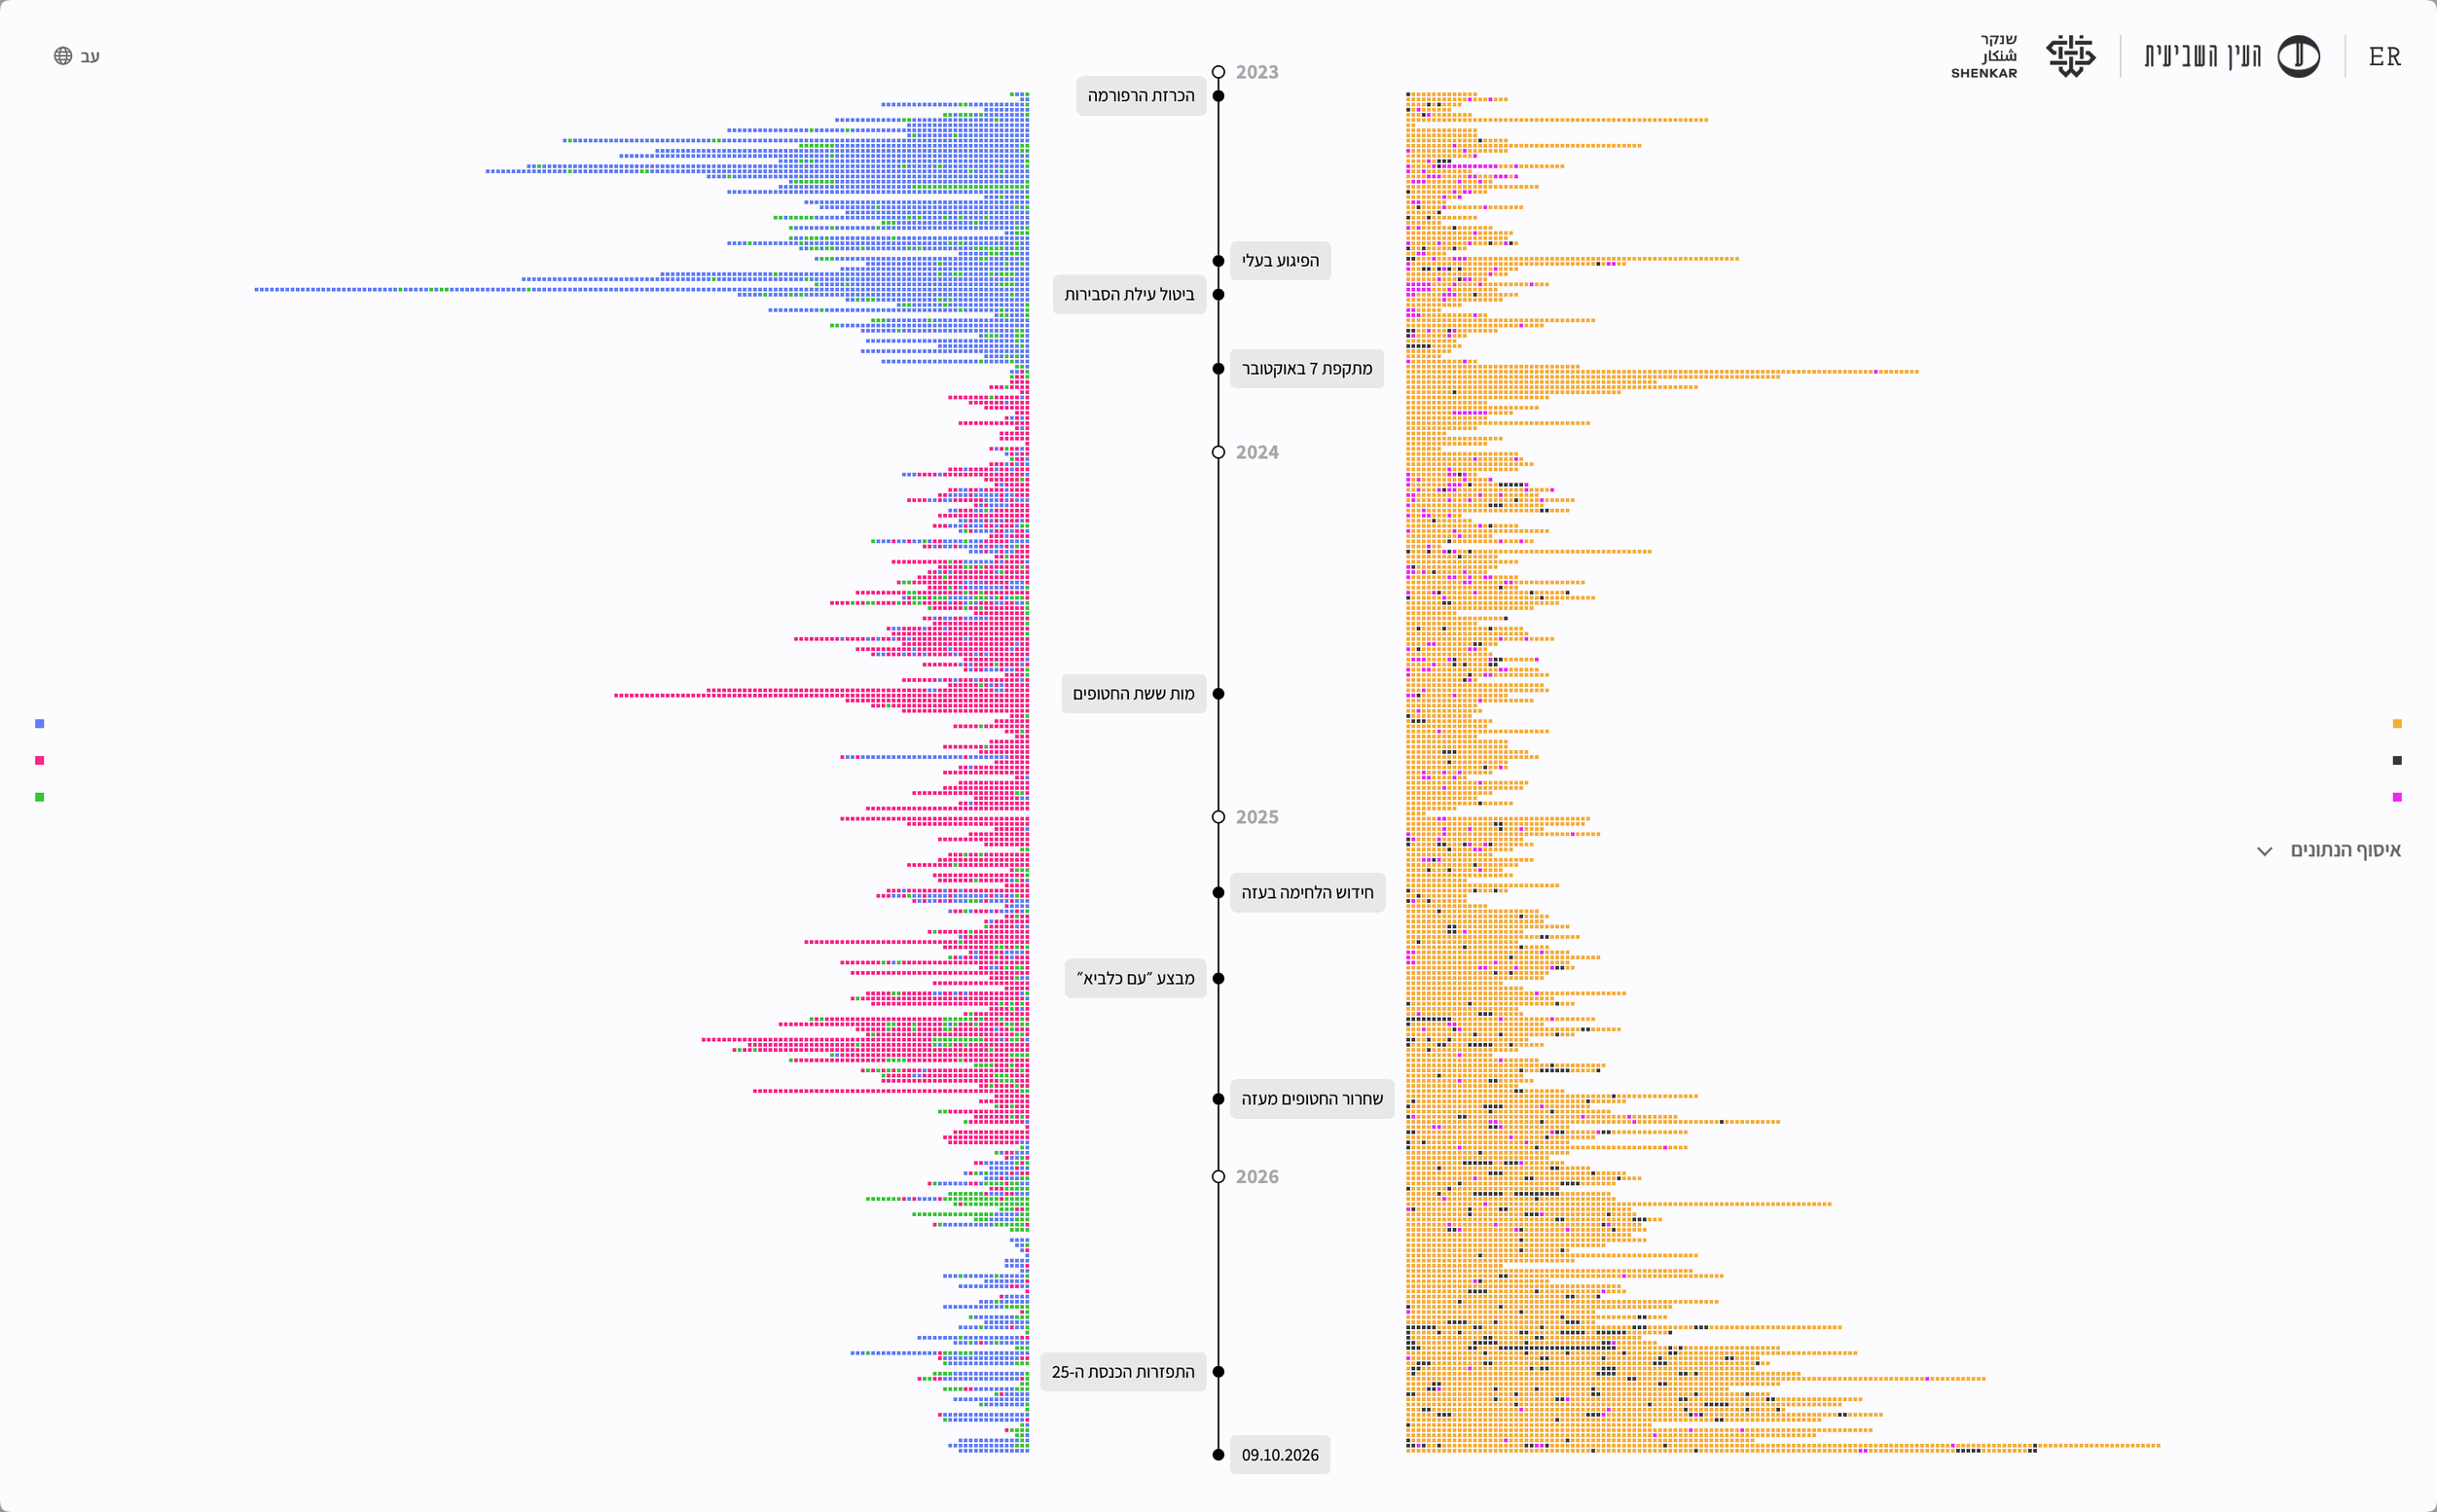
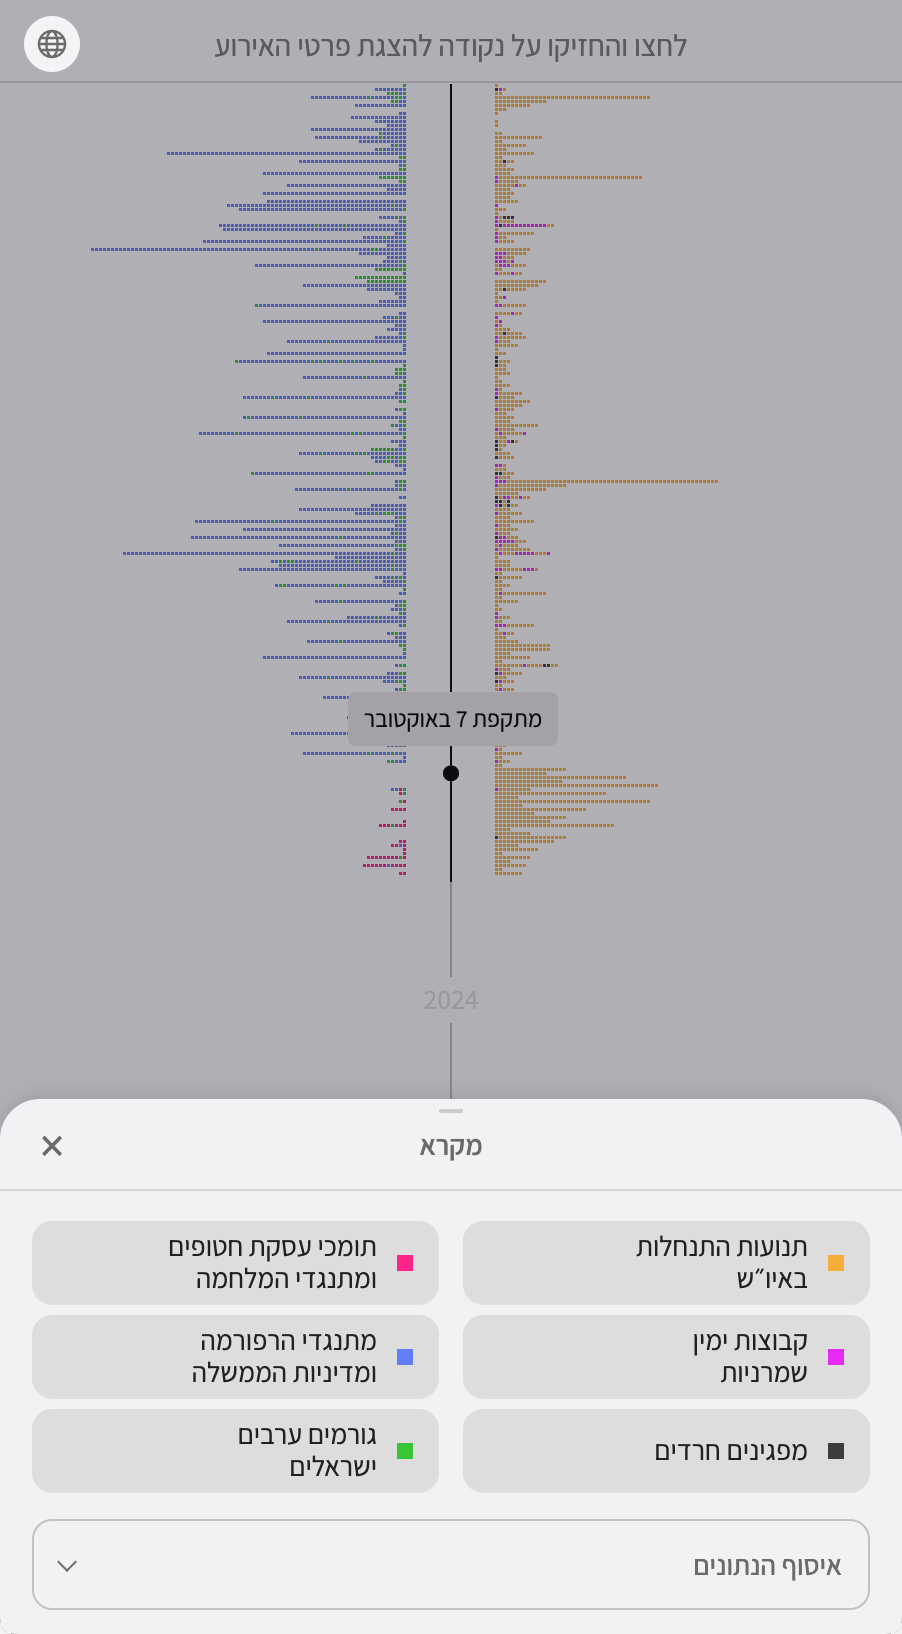
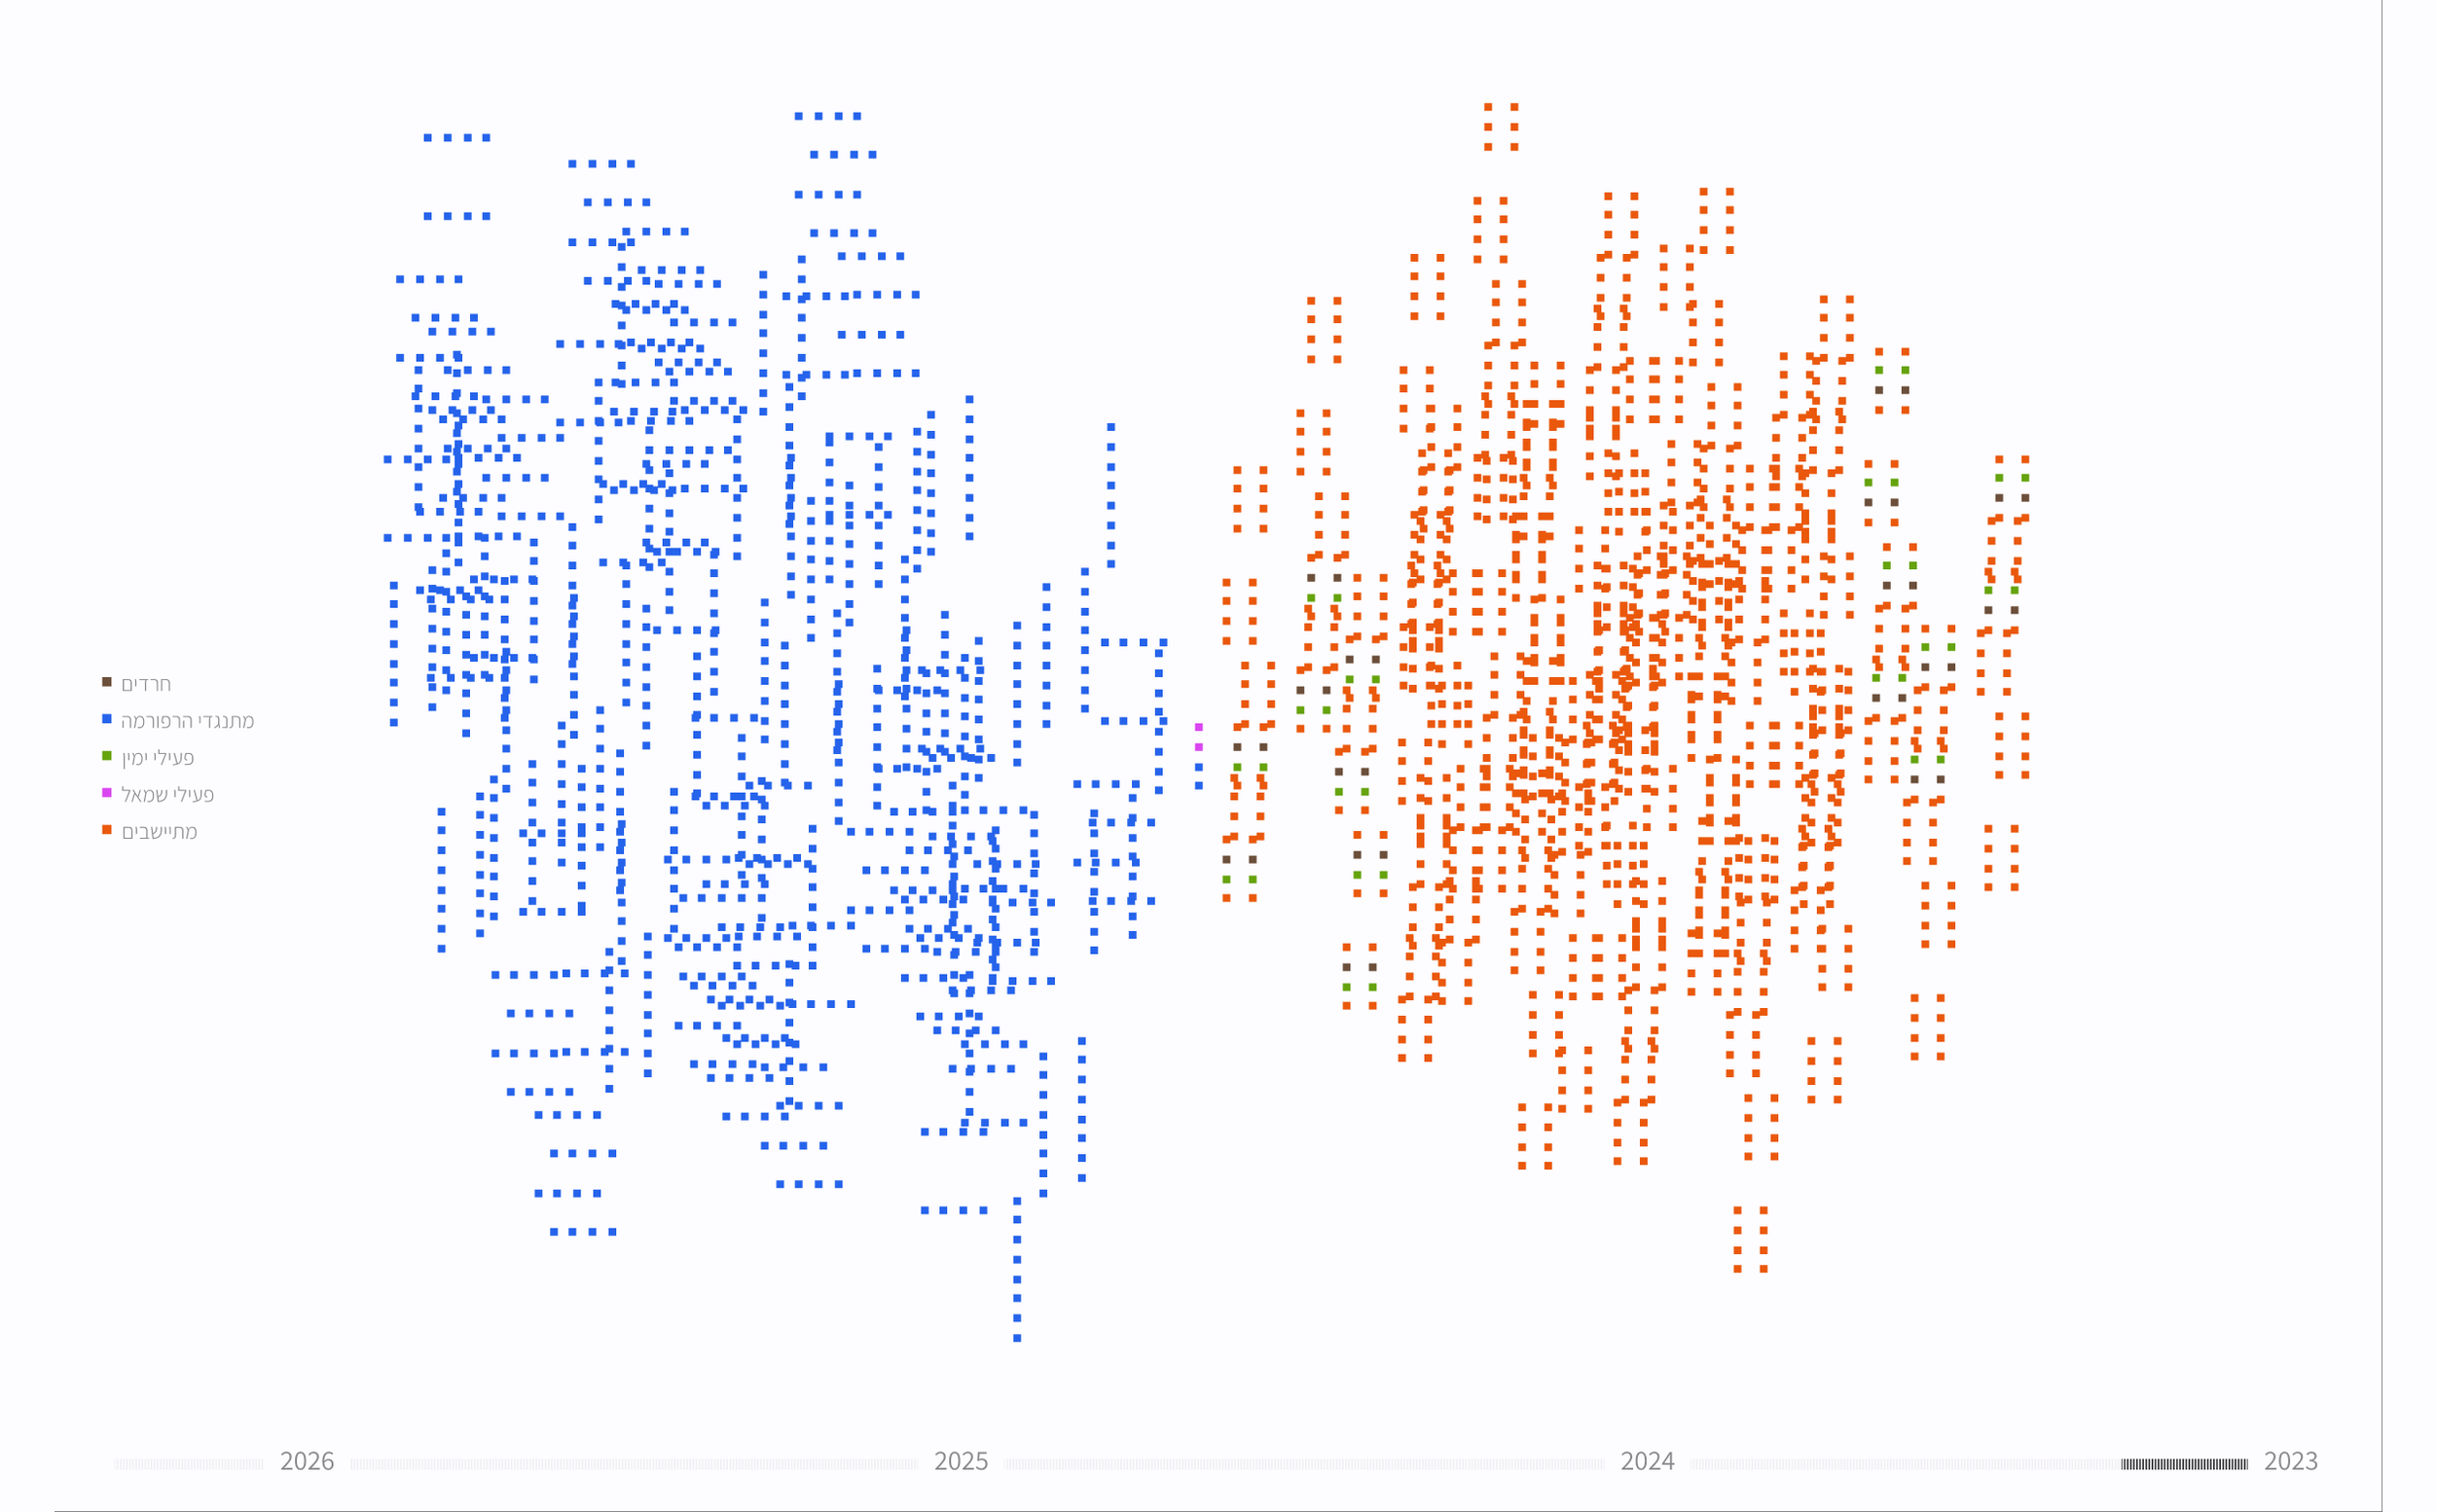
At the first visual high point, political actions take shape along a timeline, each represented by a square in the color of the group responsible. I chose to begin in early 2023, with the start of the protests against Yariv Levin’s judicial overhaul, the point when the portrayal of groups within the Change Bloc as extremists became more widespread. Milestones marked along the timeline help explain increases and decreases in the activity of the camps and groups.
Does One Person’s Action Count the Same as an Action by Hundreds of Thousands?
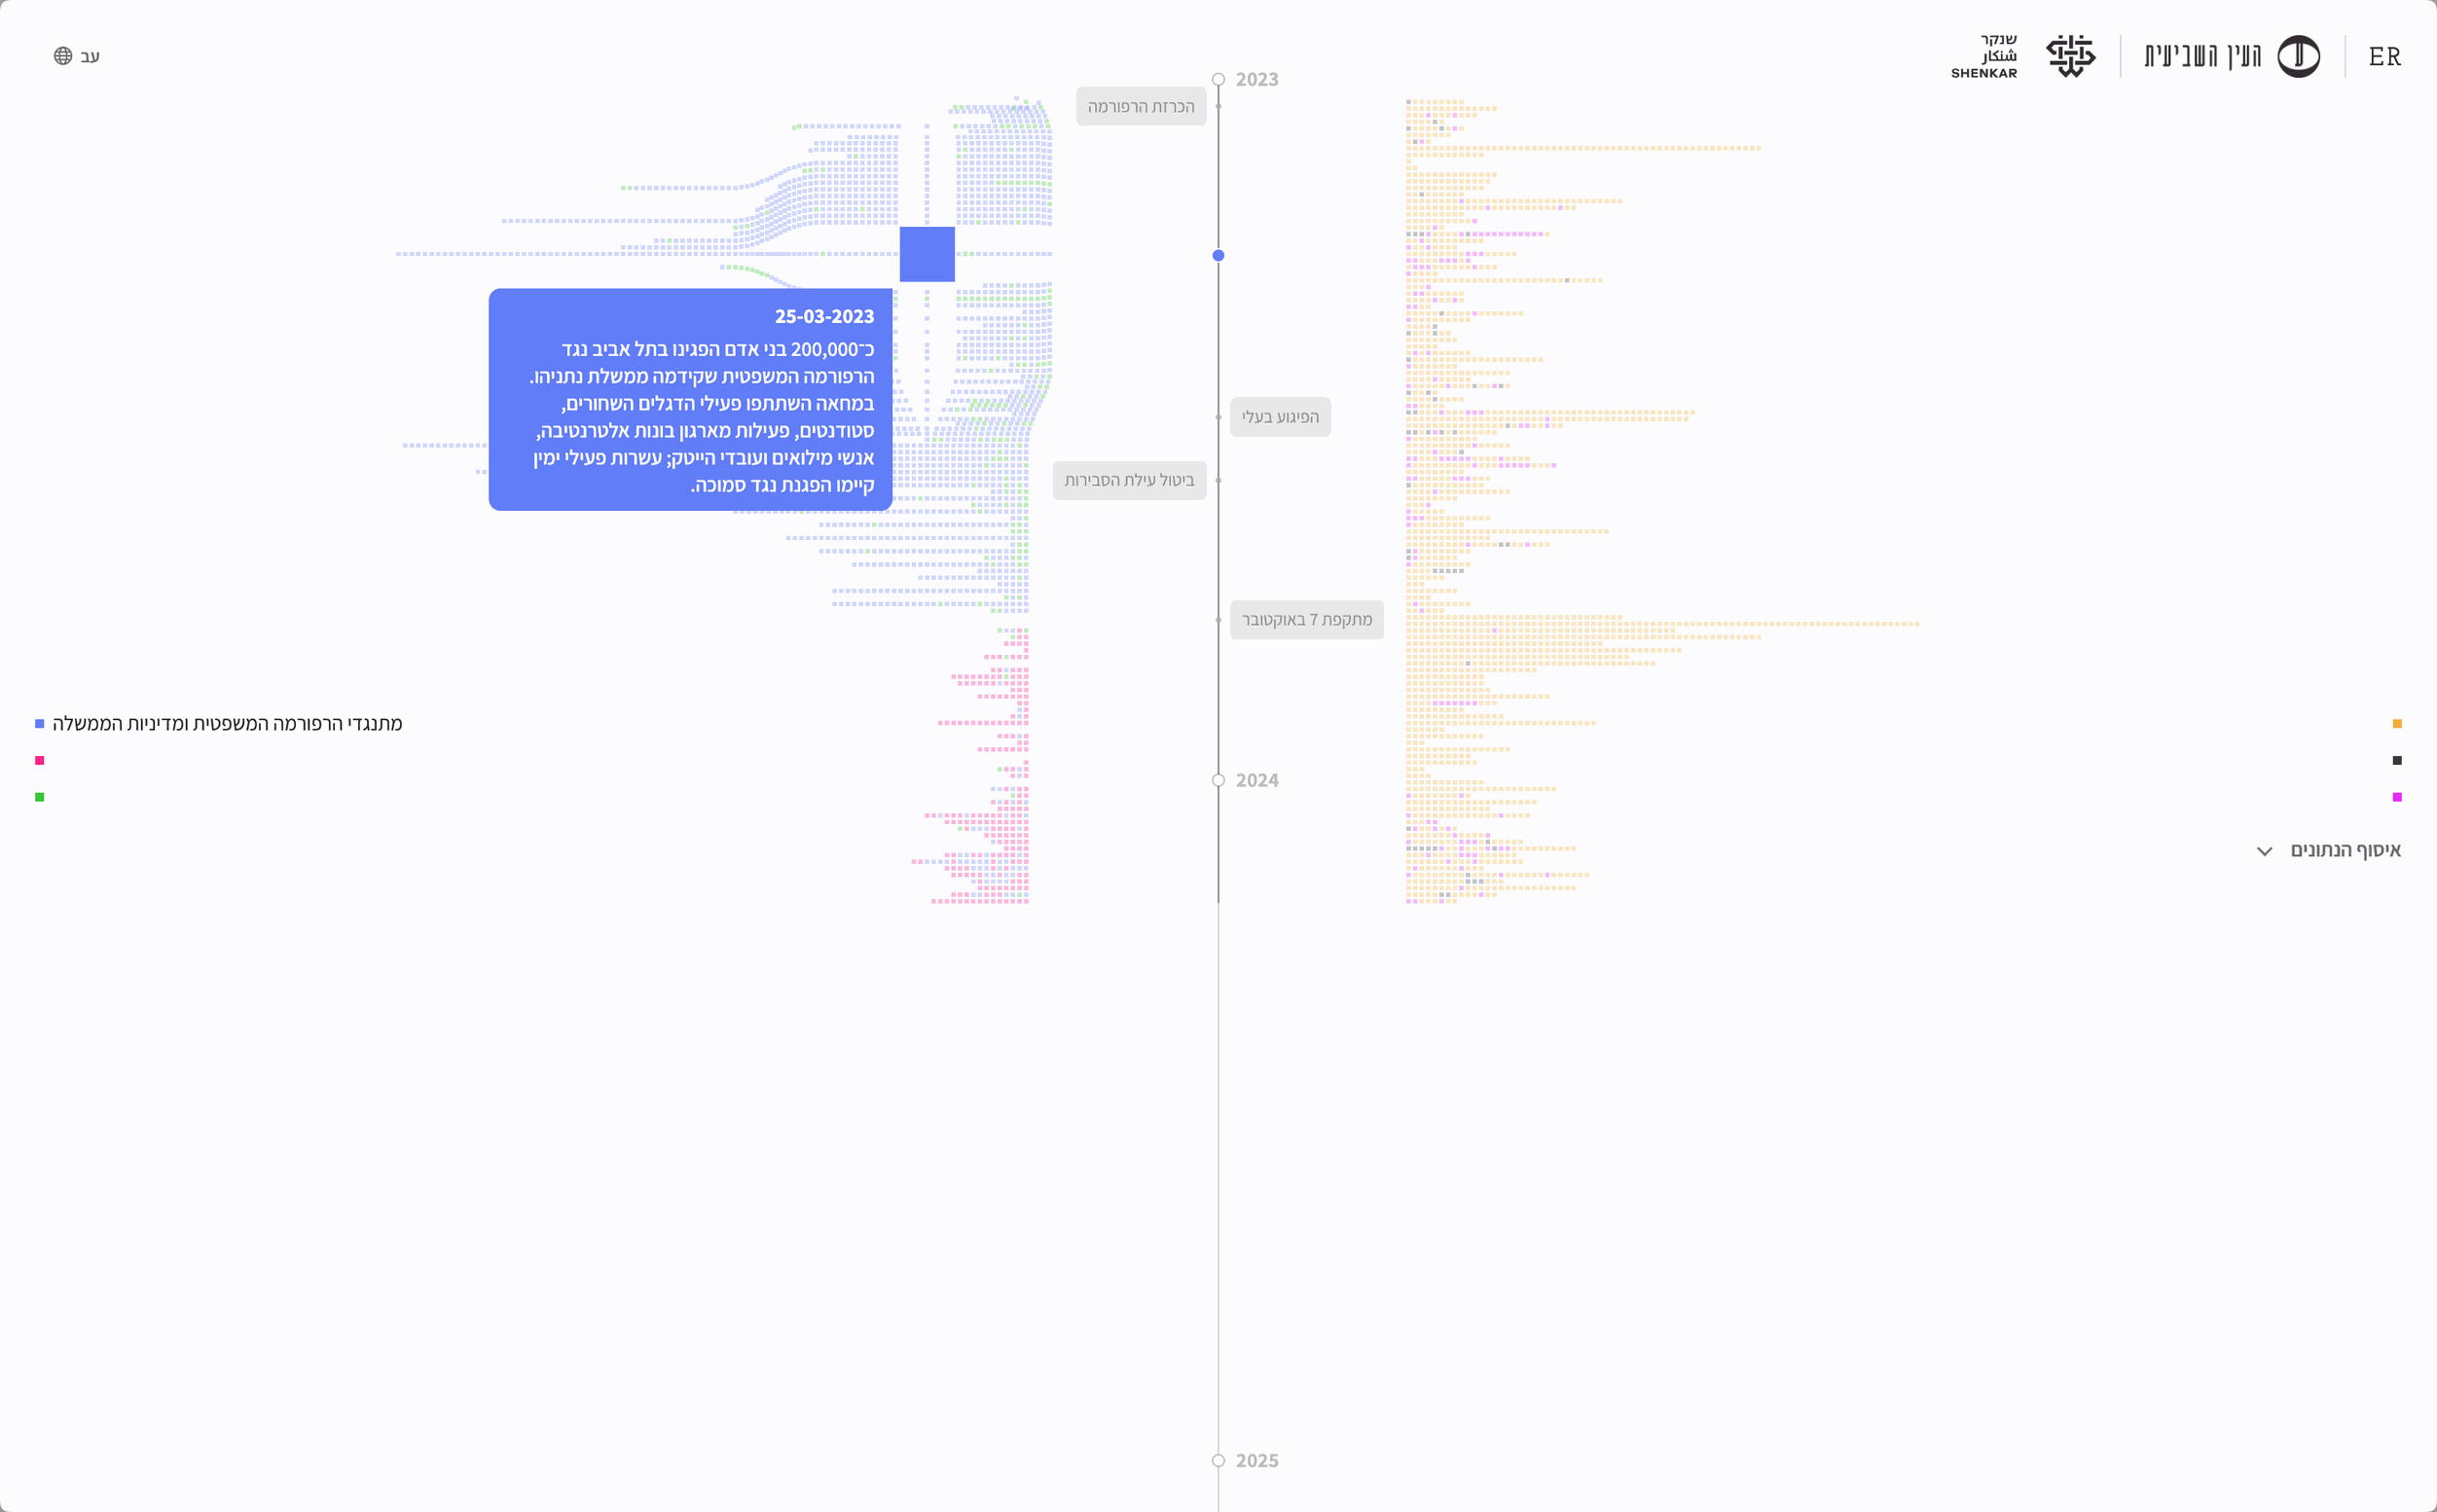
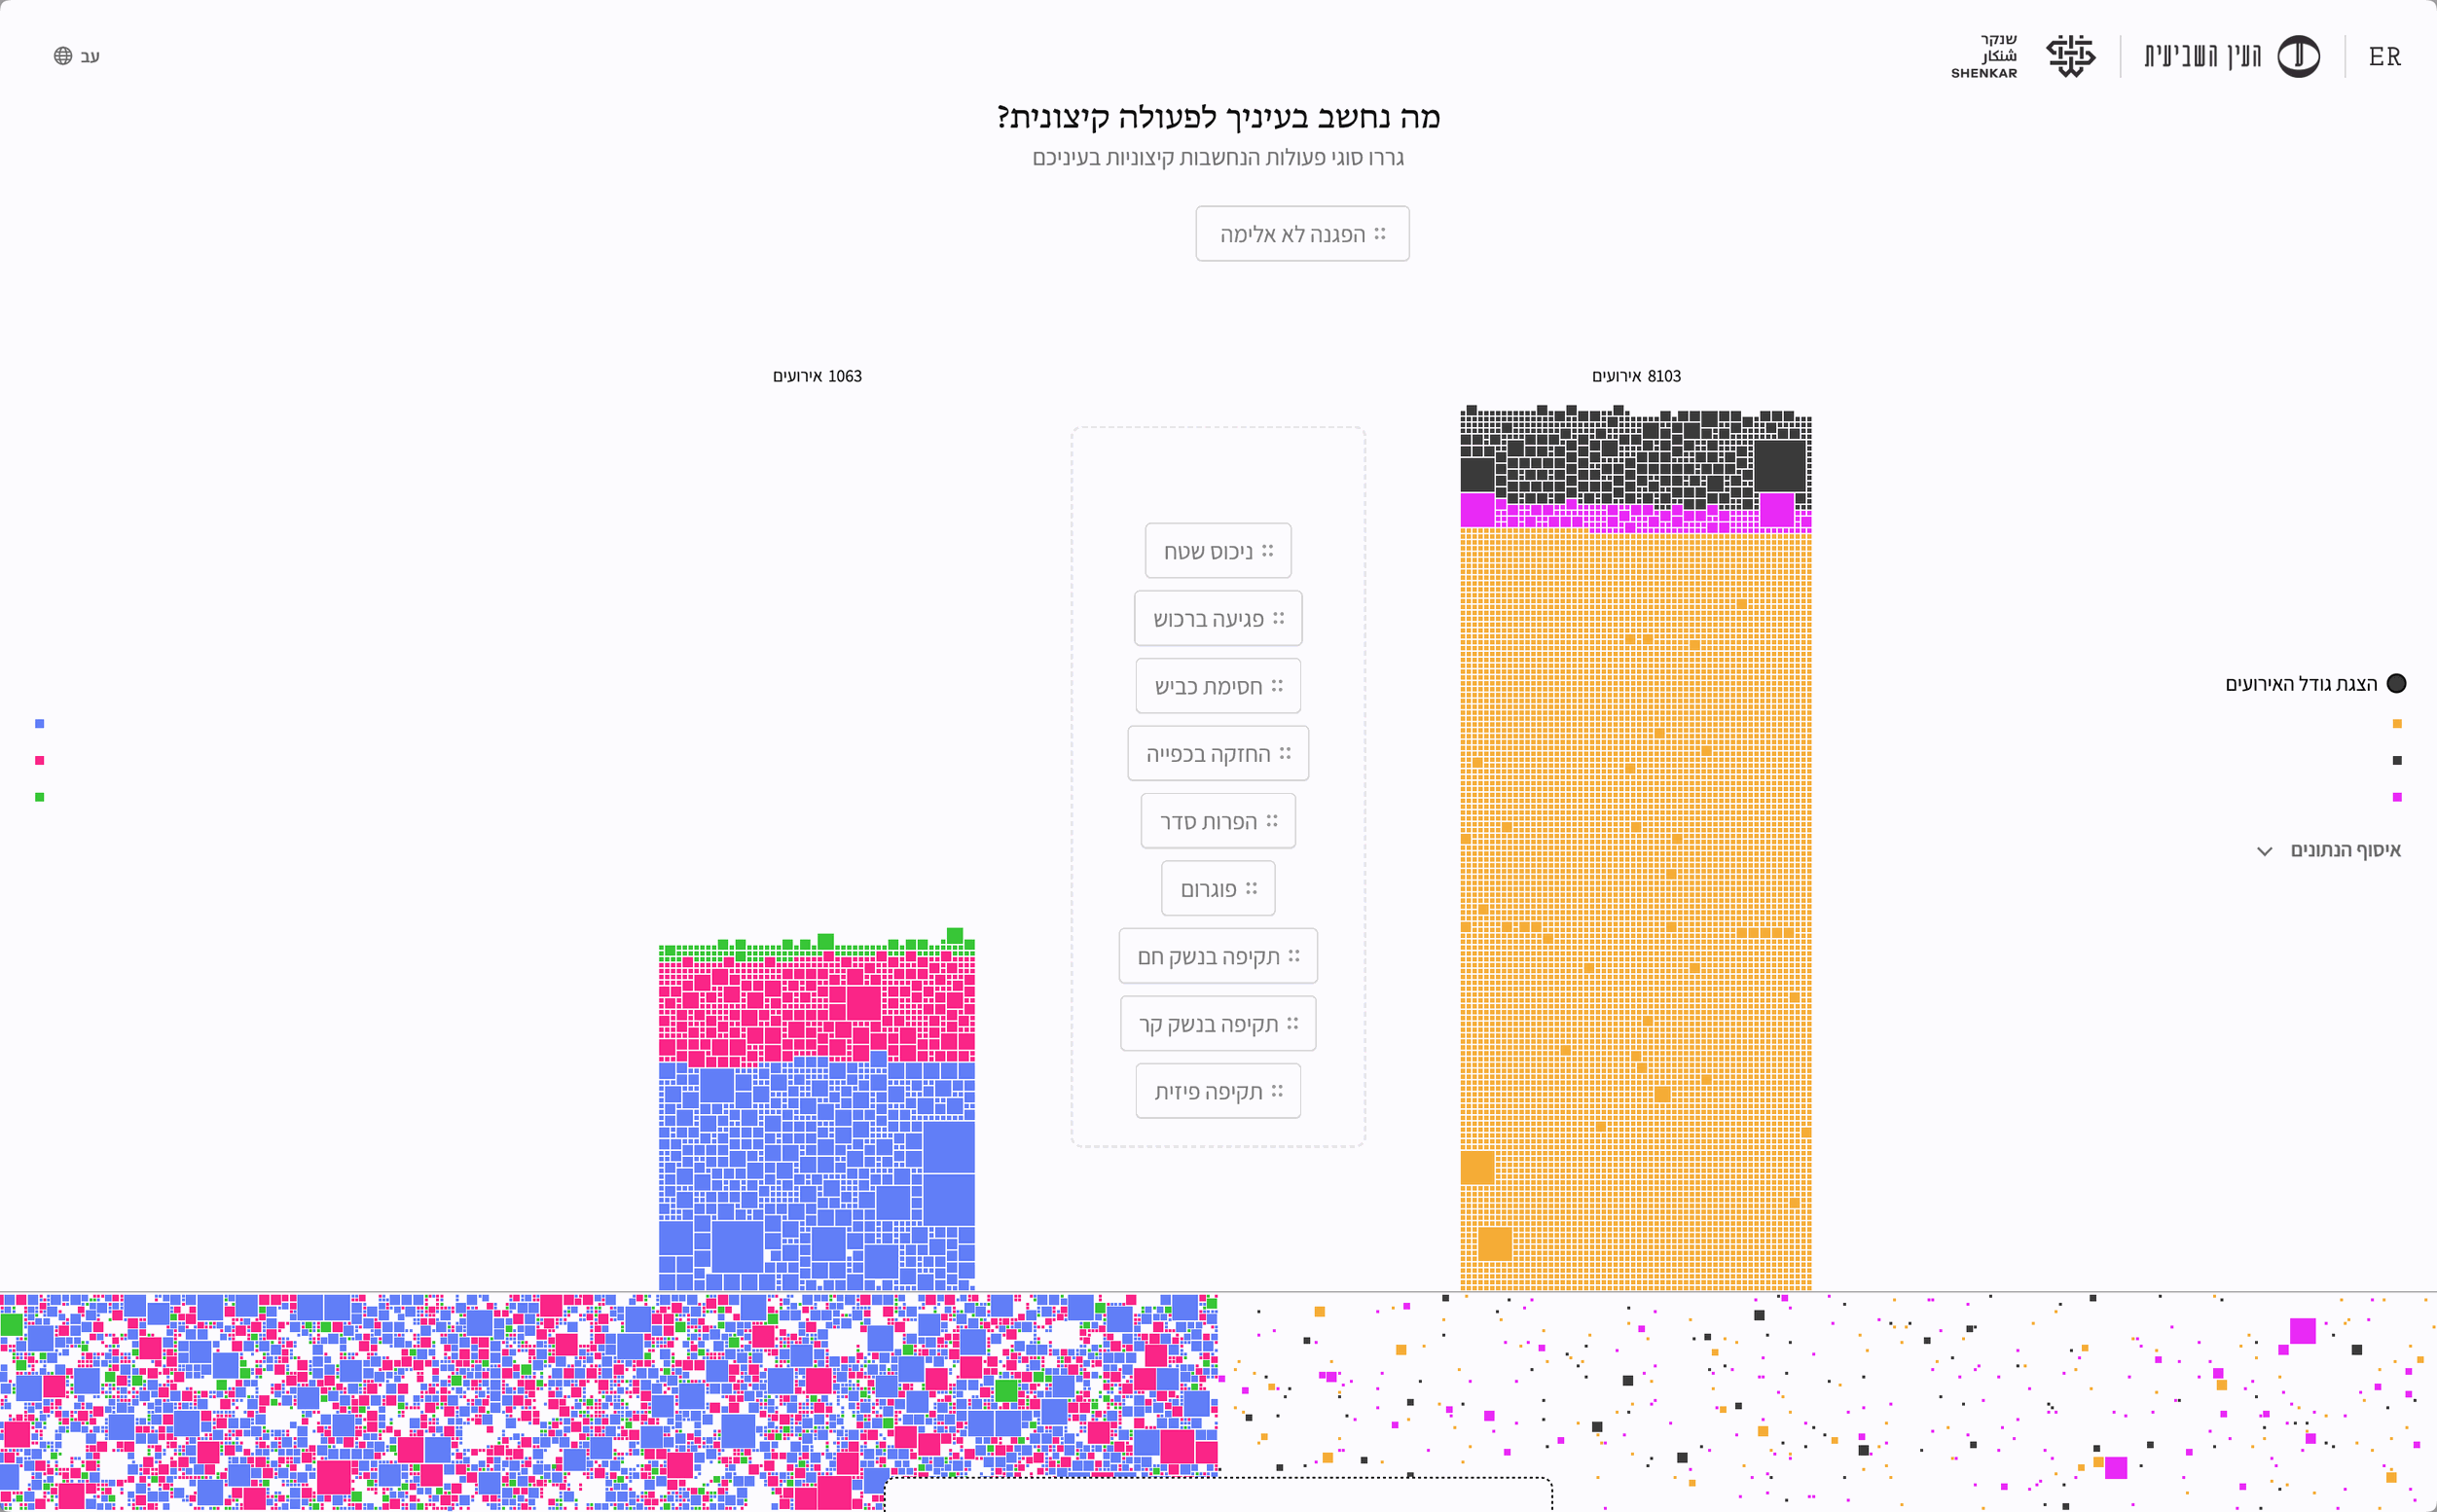
I added a way to show the number of participants in each action after feedback from journalist Shaul Amsterdamski. It created a significant design challenge. My first instinct was to map participant numbers to the size of each square, but the varying sizes made the timeline harder to read and obscured patterns of activity. I eventually decided to reveal an event’s size when users choose to explore its details. I also dedicated a separate section to differences in event size and added the option to display those sizes in the final comparison, which reflects users’ own values, to keep that information fully accessible.
What Do You Consider Extreme?
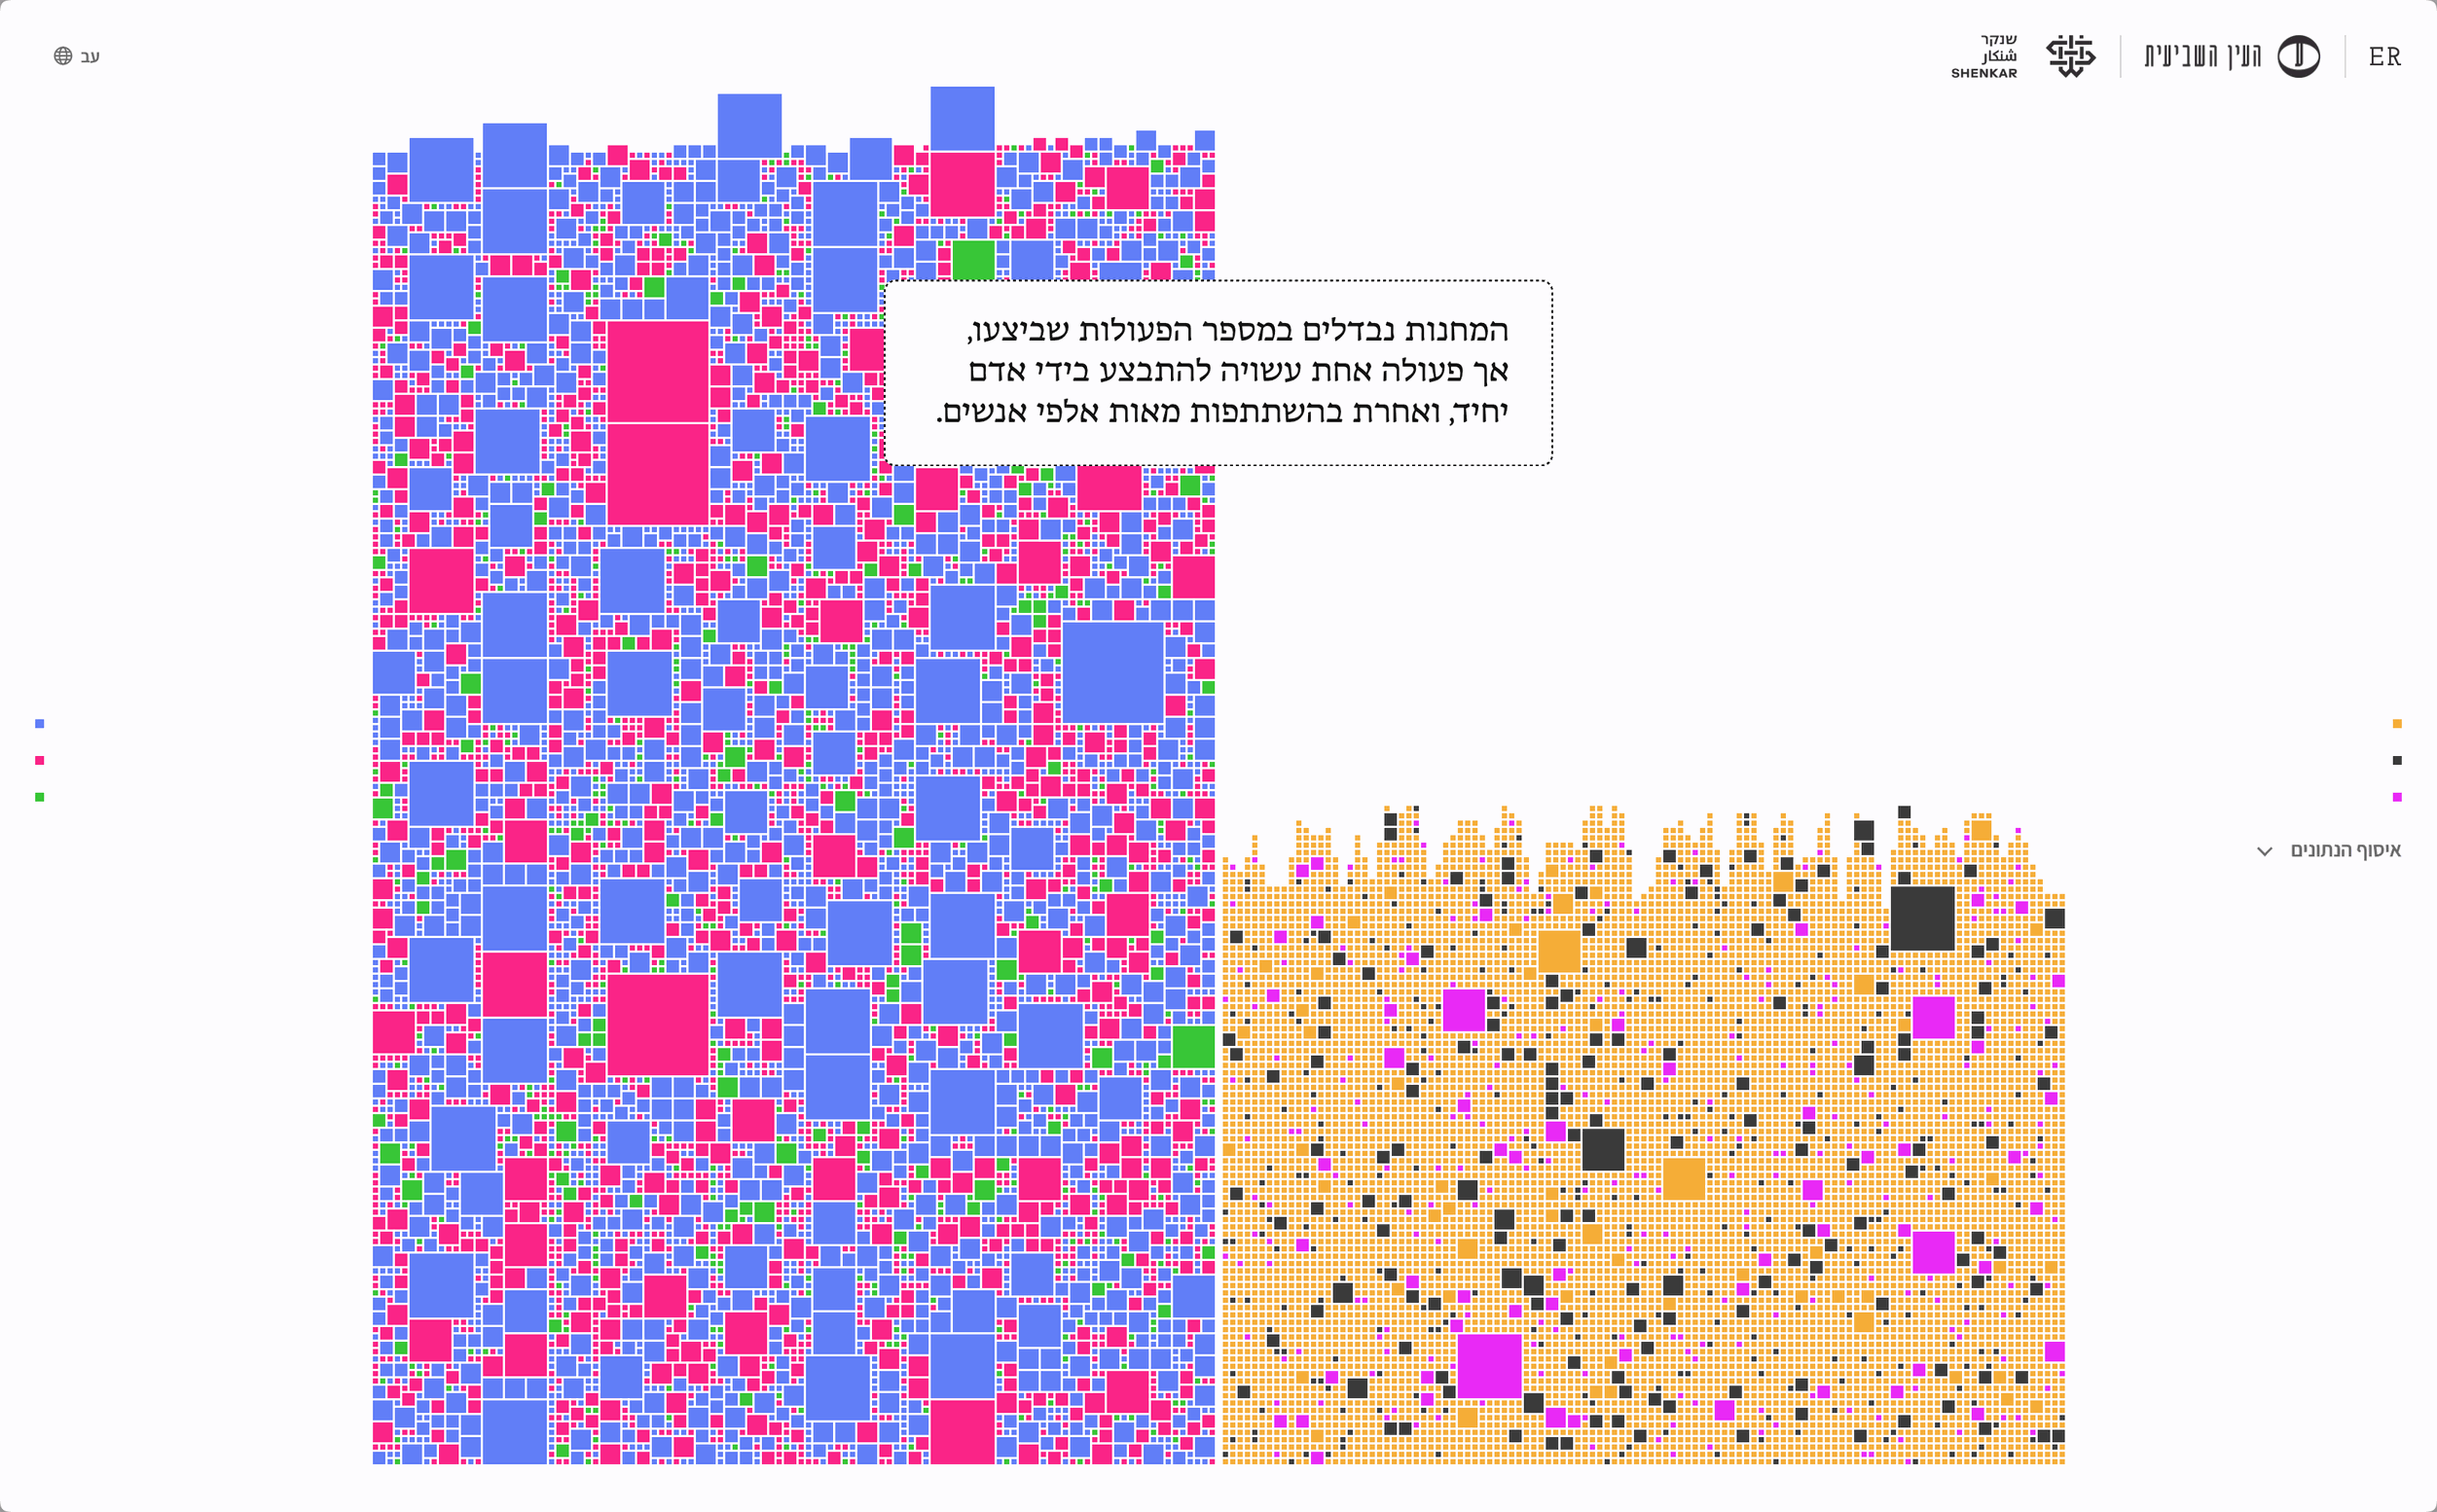
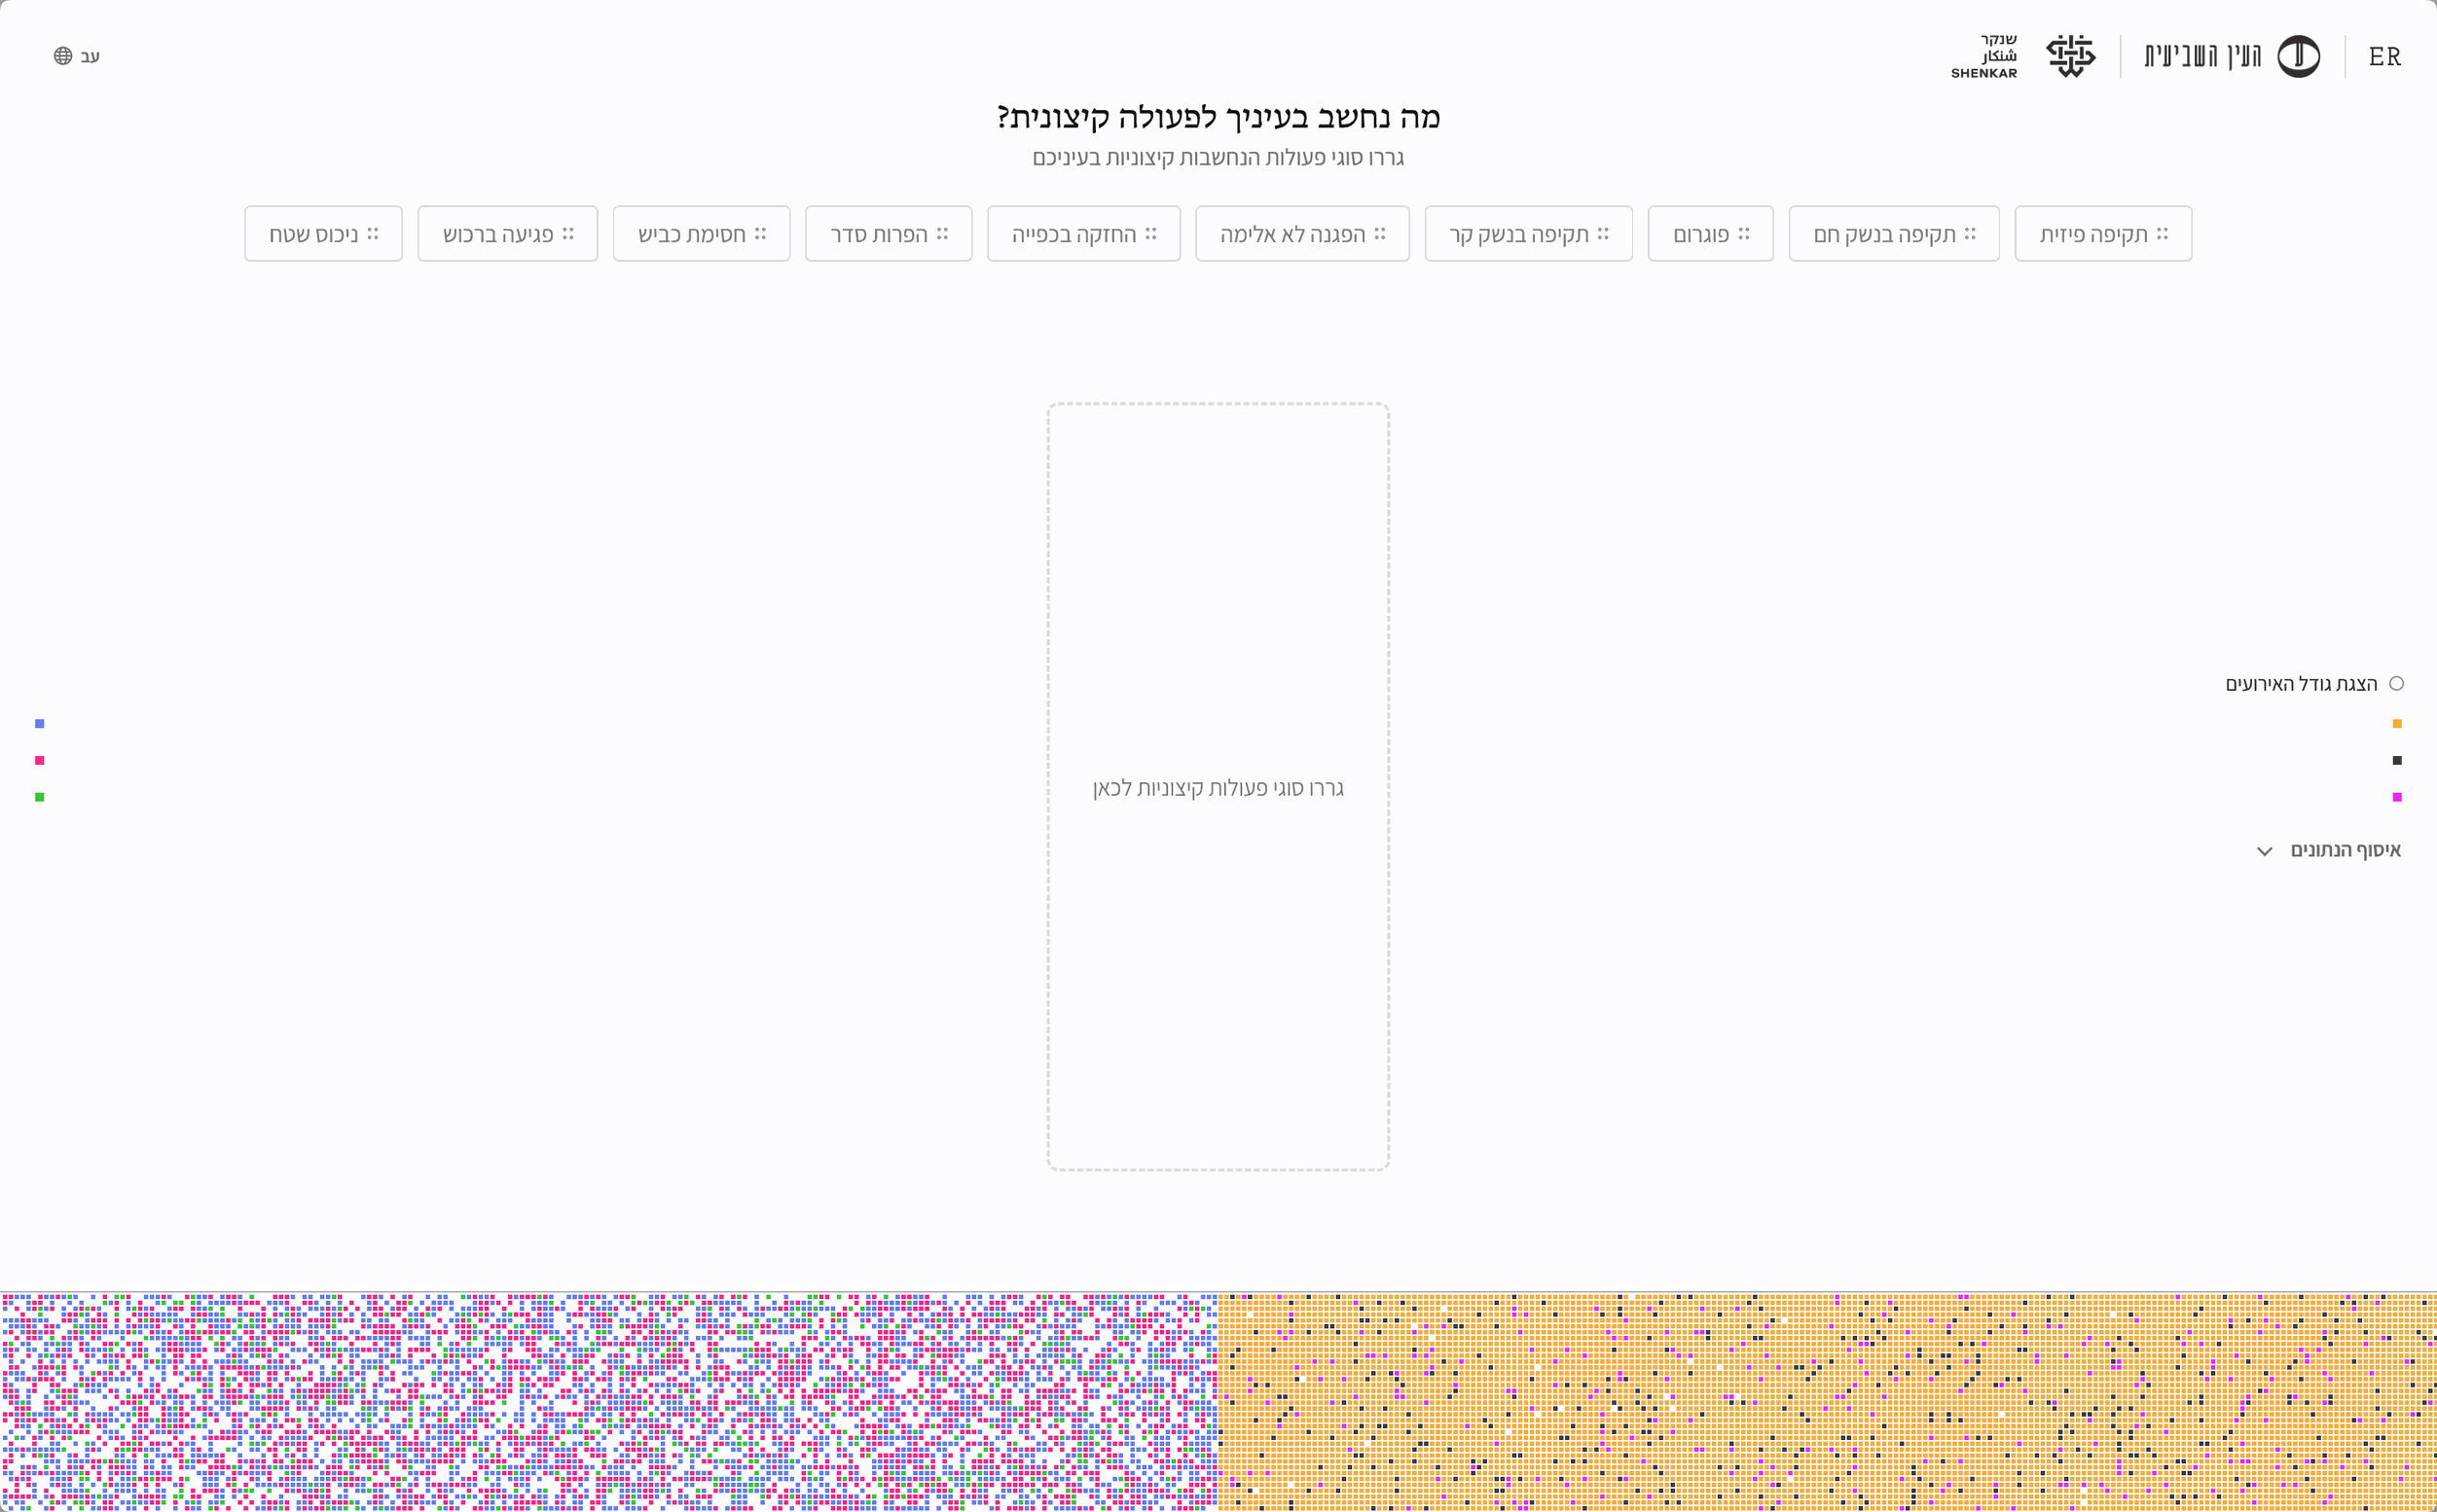
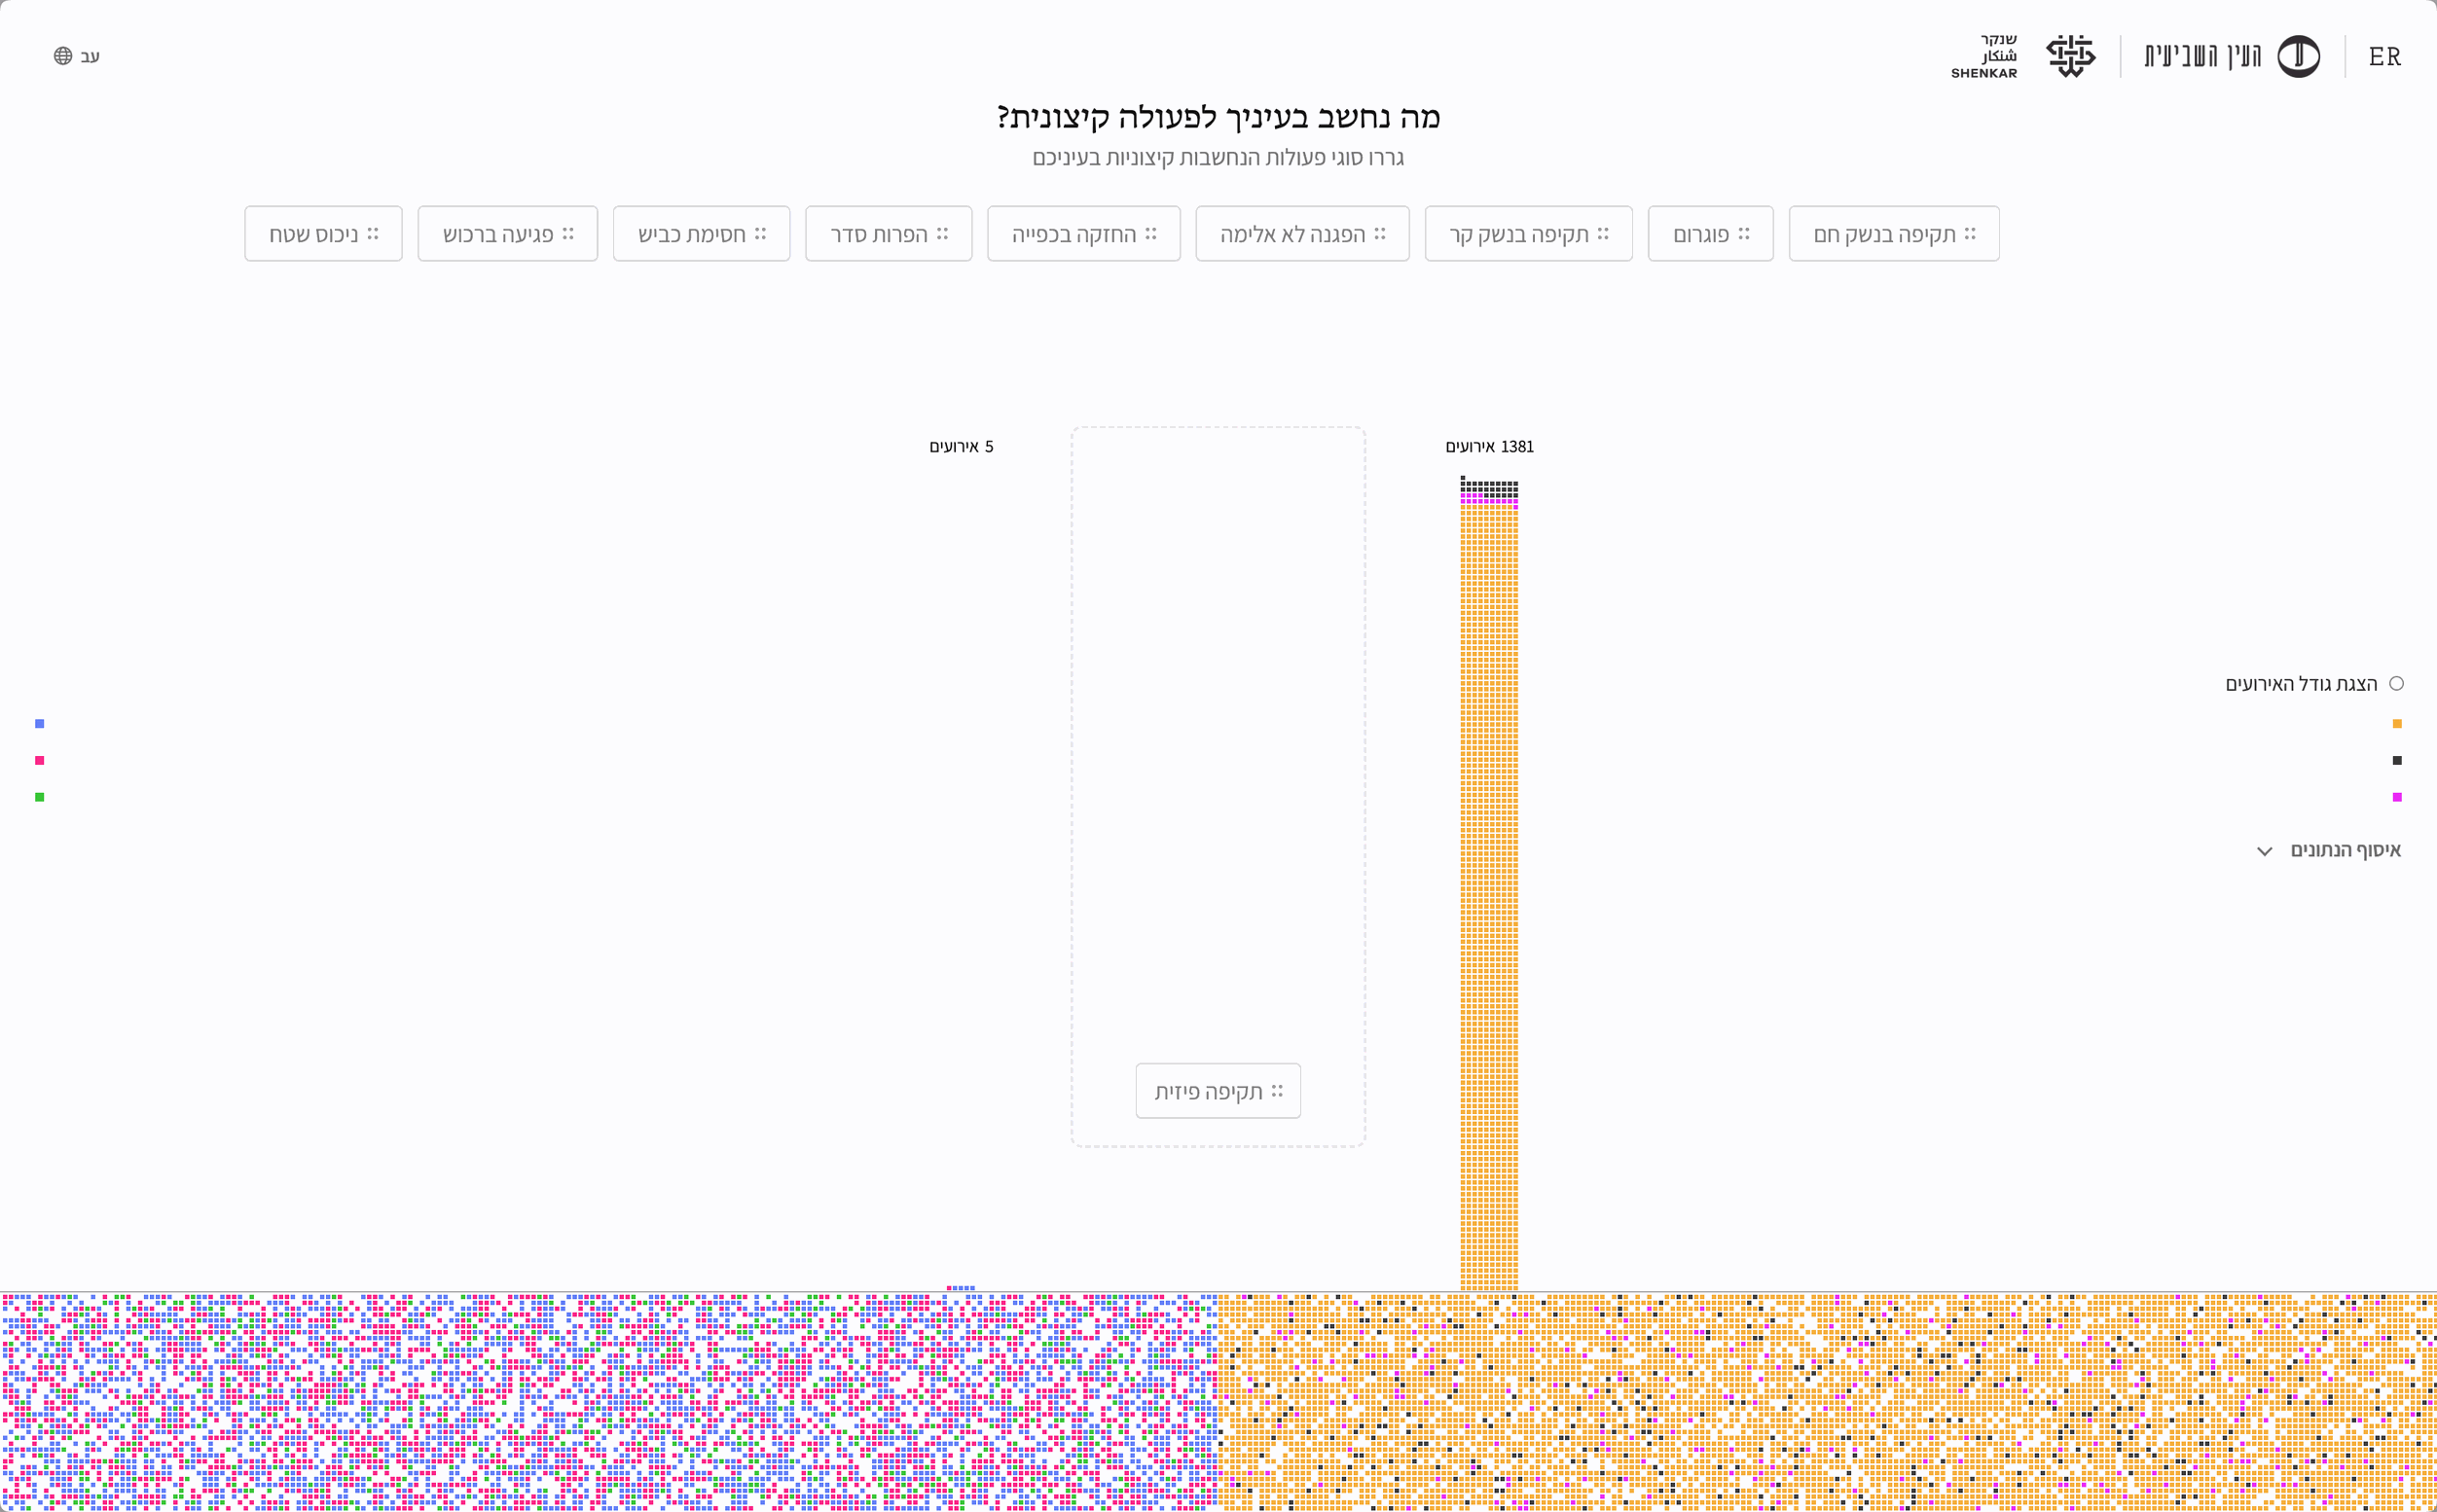
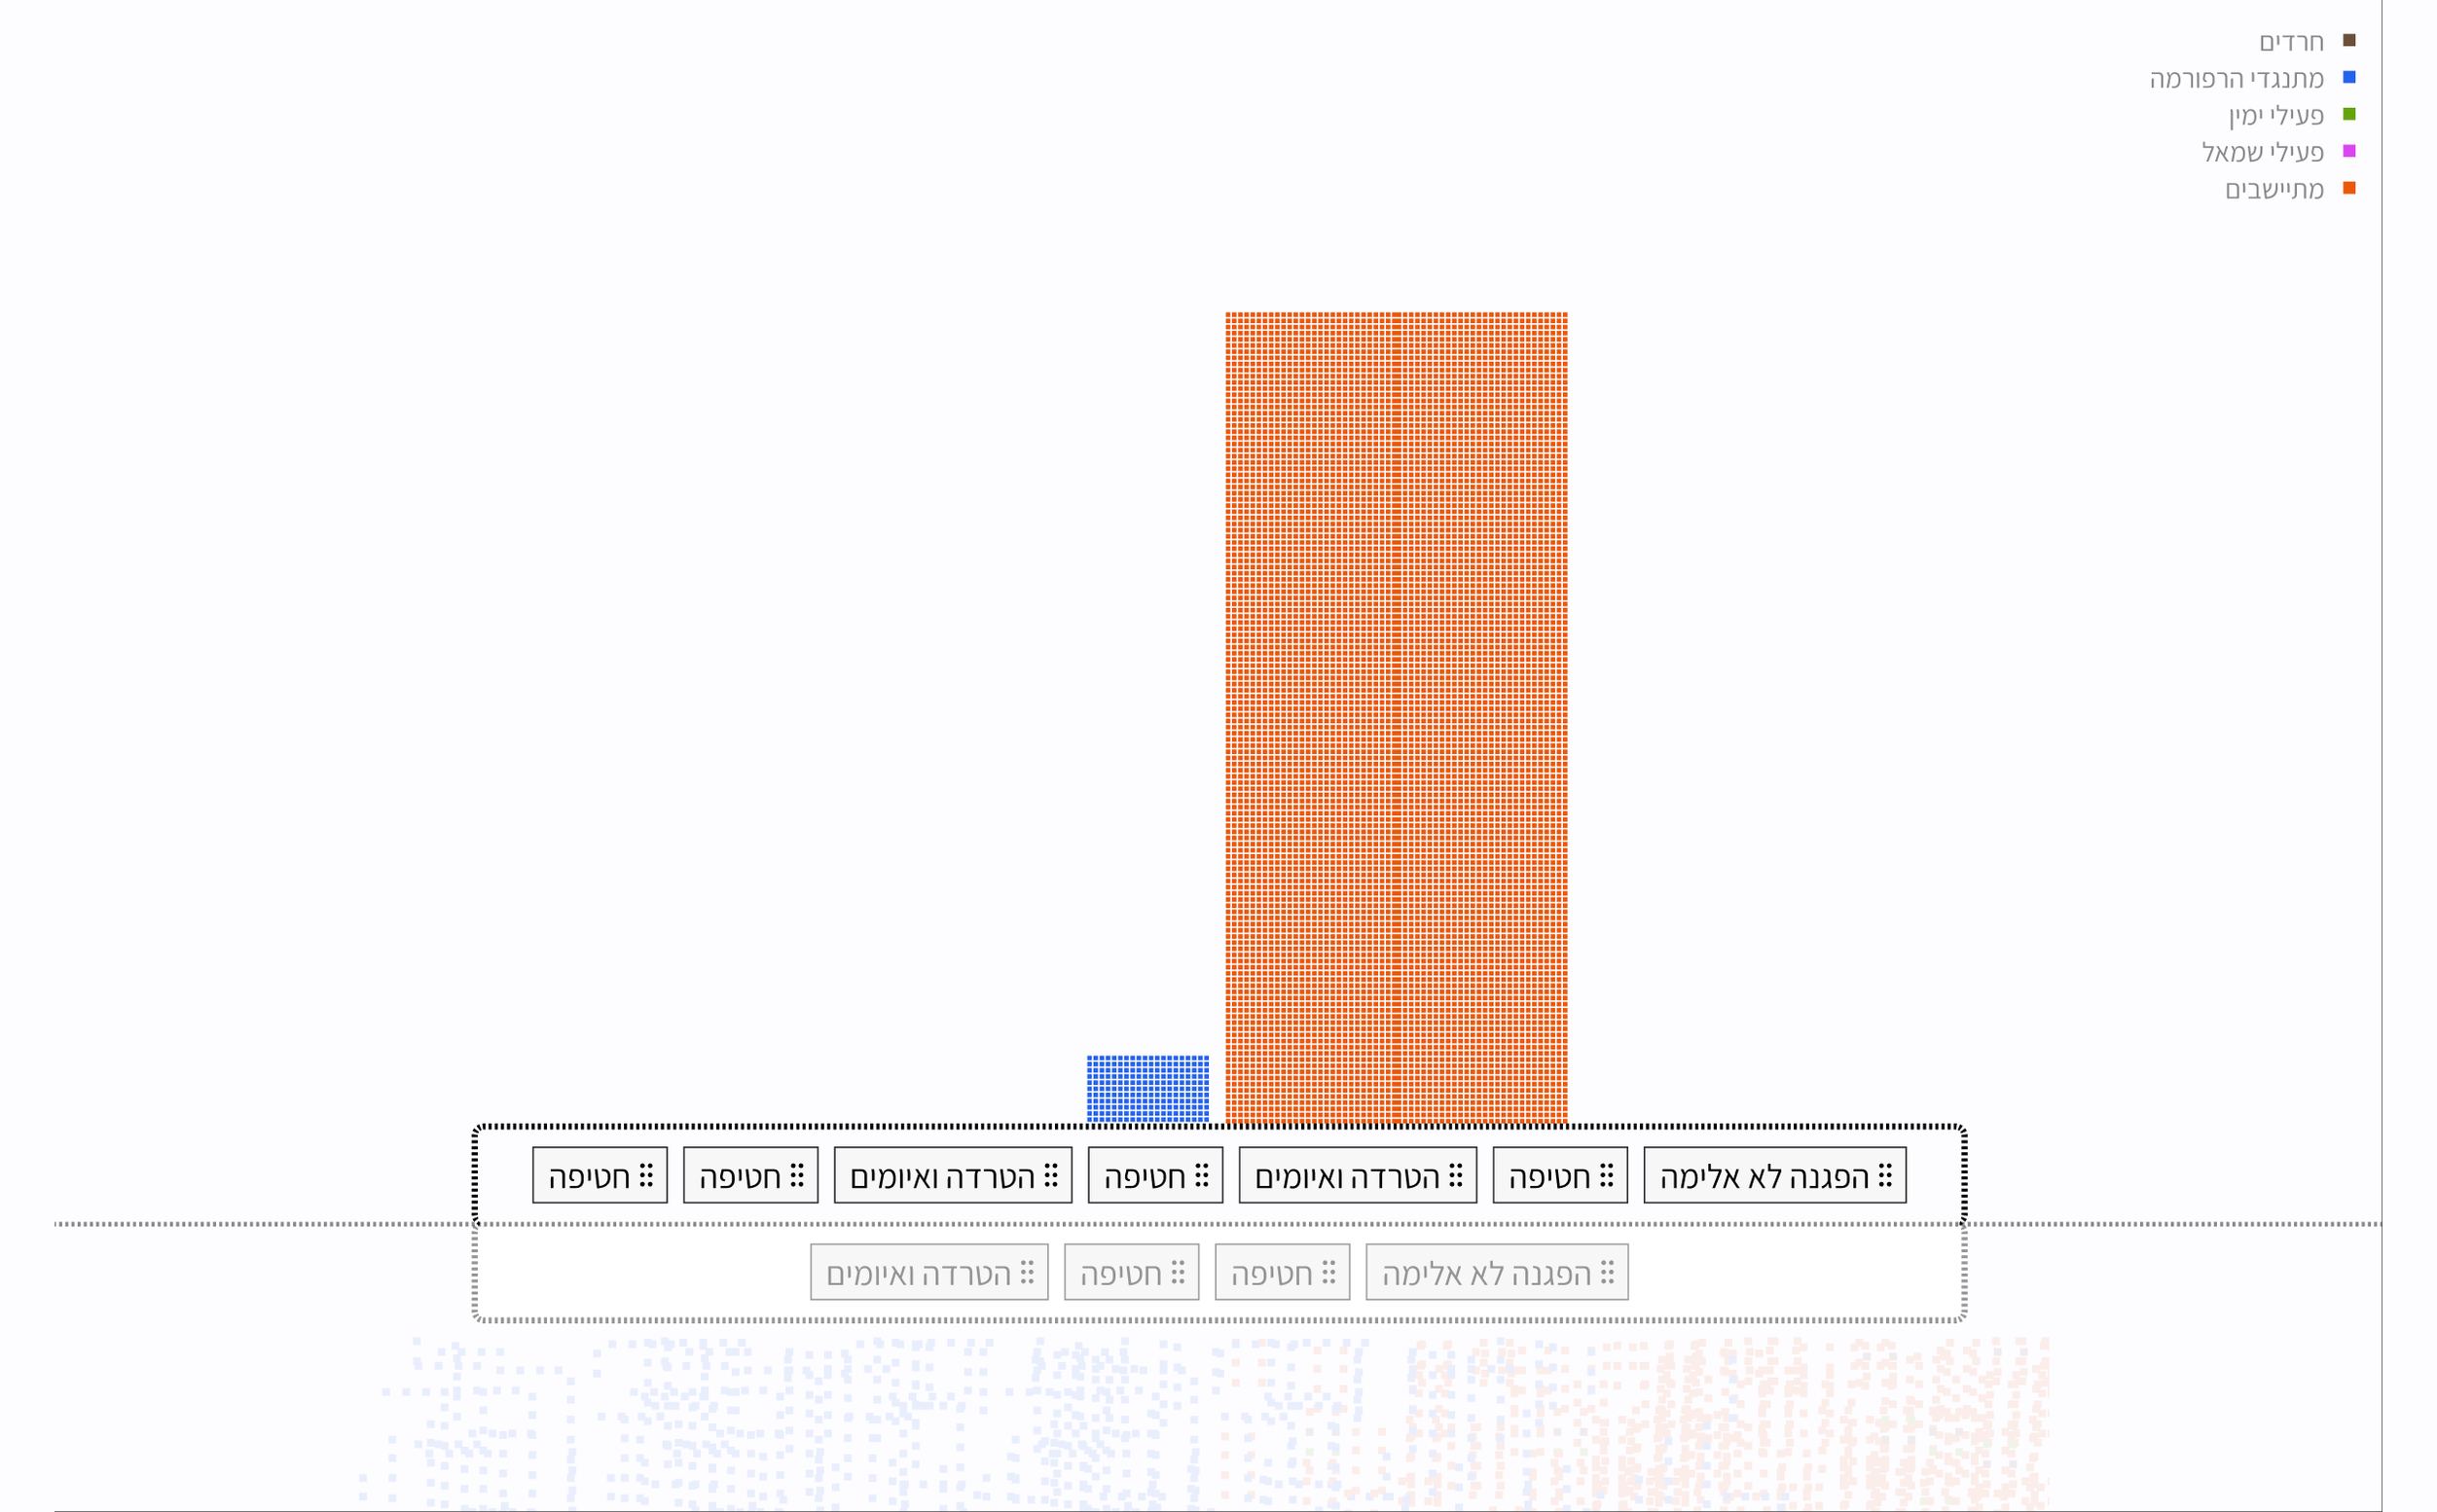
In the comparison stage, users are asked to drag the types of actions they consider extreme to the center of the screen. The options range from nonviolent demonstrations to pogroms, with no visual hierarchy or order suggesting how severe they are. The decision about which actions are extreme remains with the user. I chose this interaction so that users would examine Israeli society through their own values, rather than have mine imposed on them, and confront the implications of applying their choices to both camps.
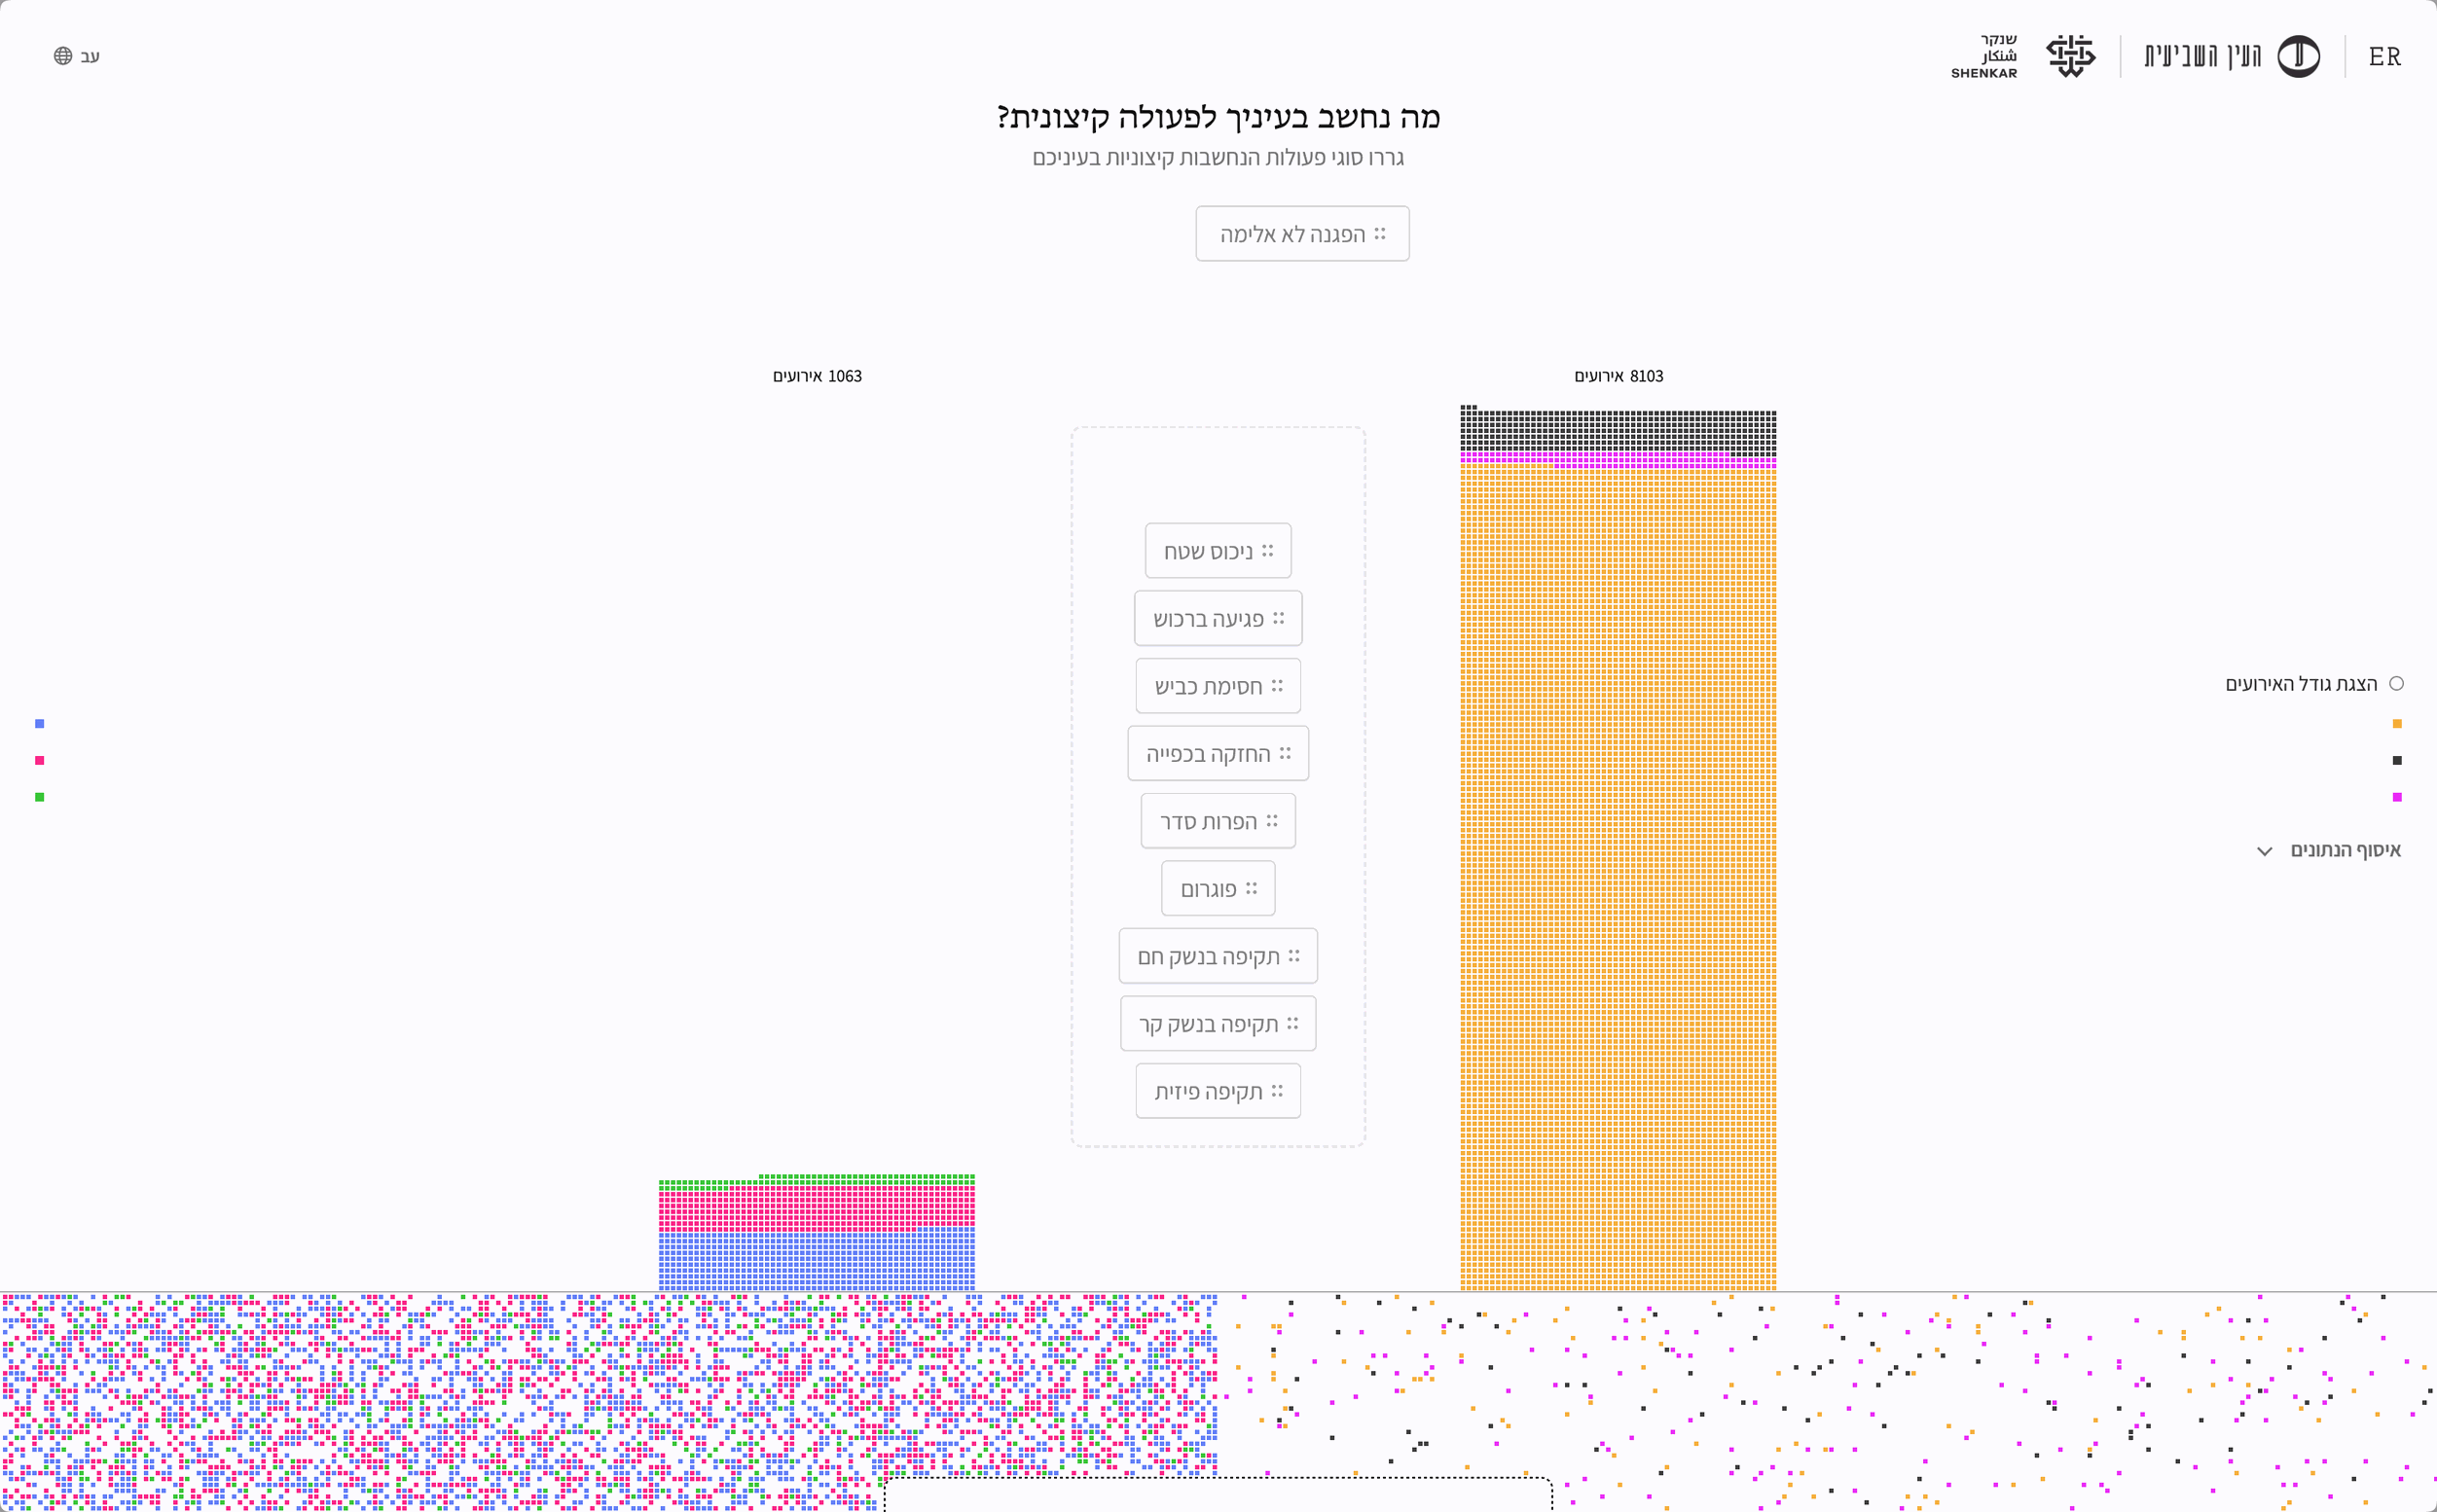
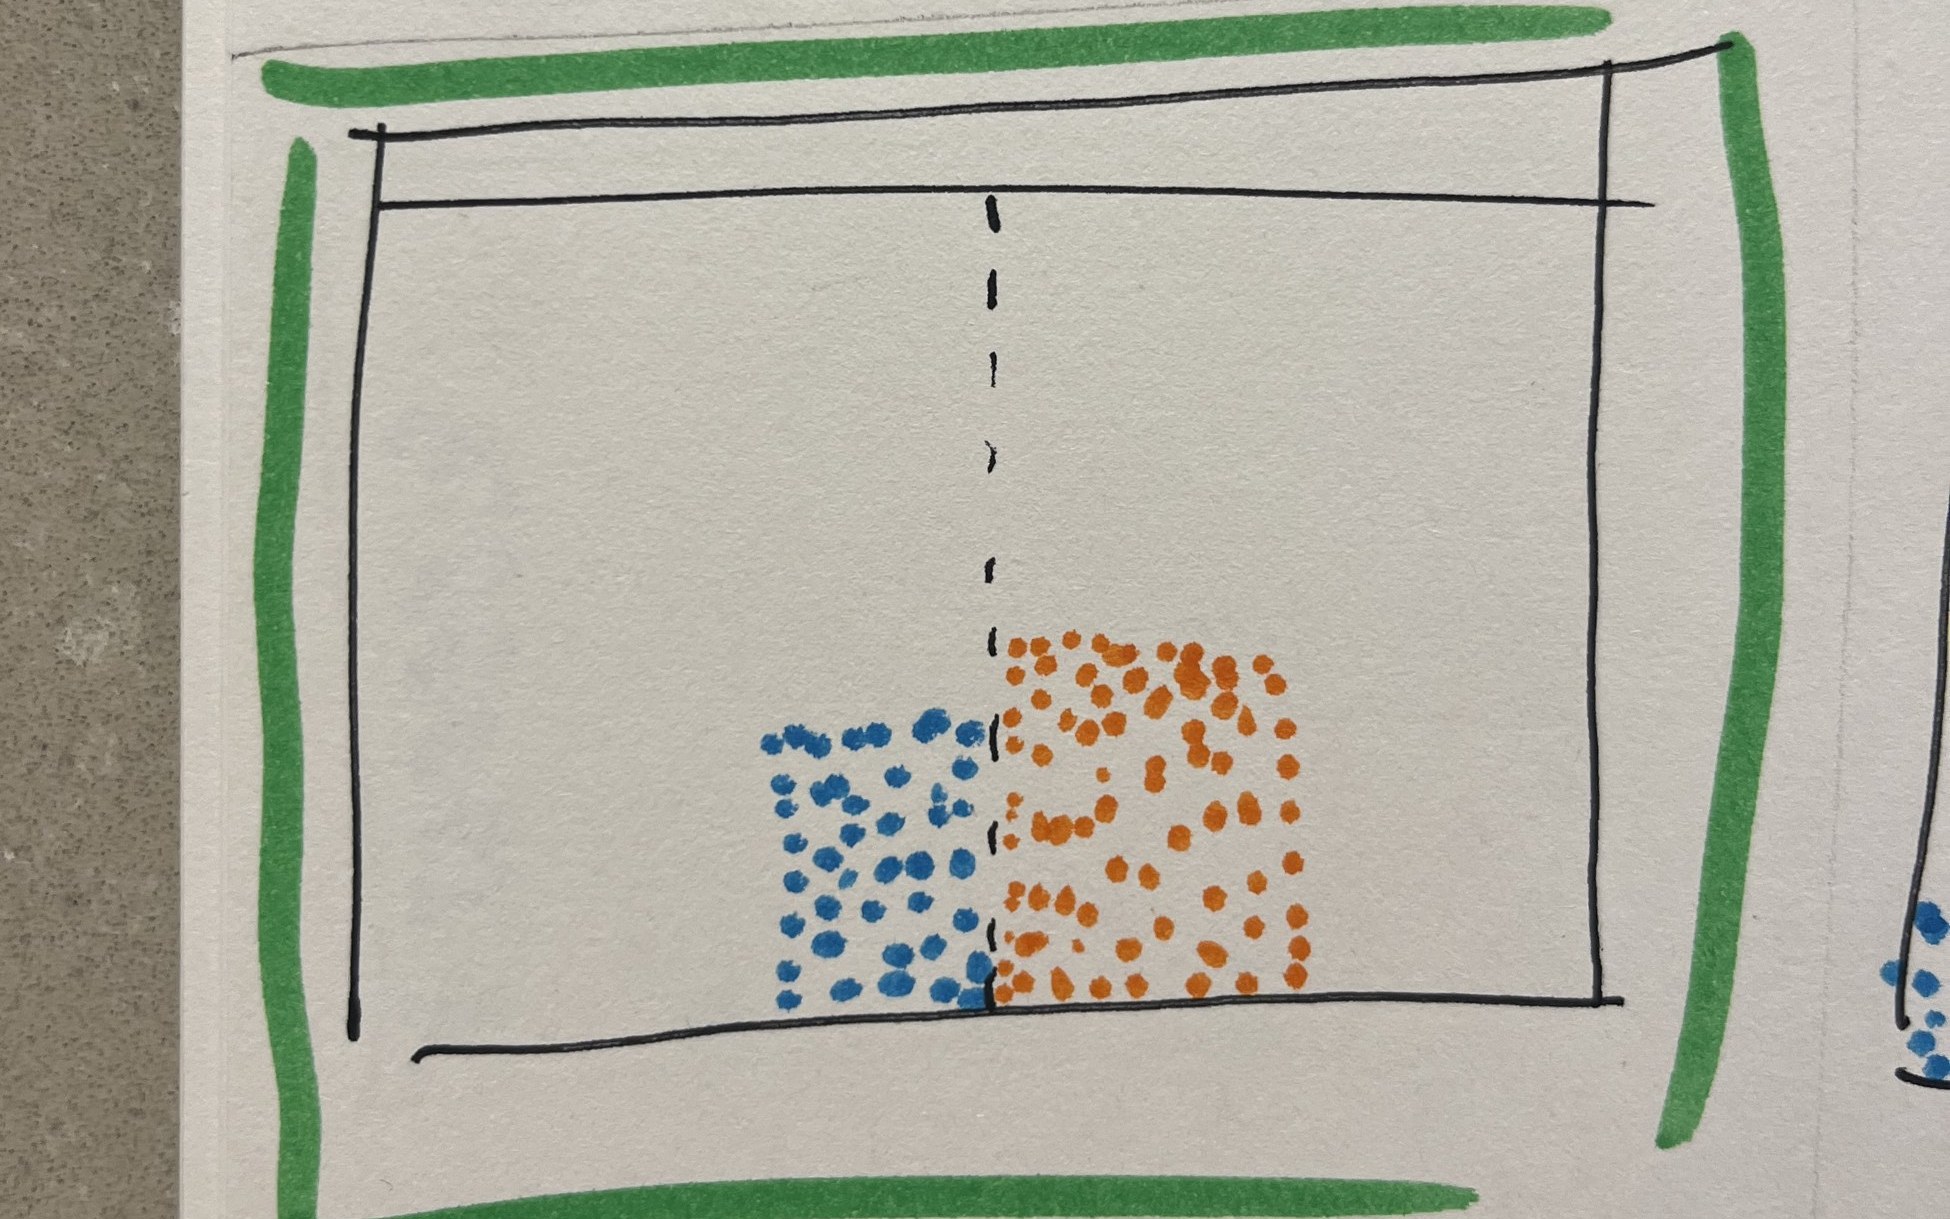
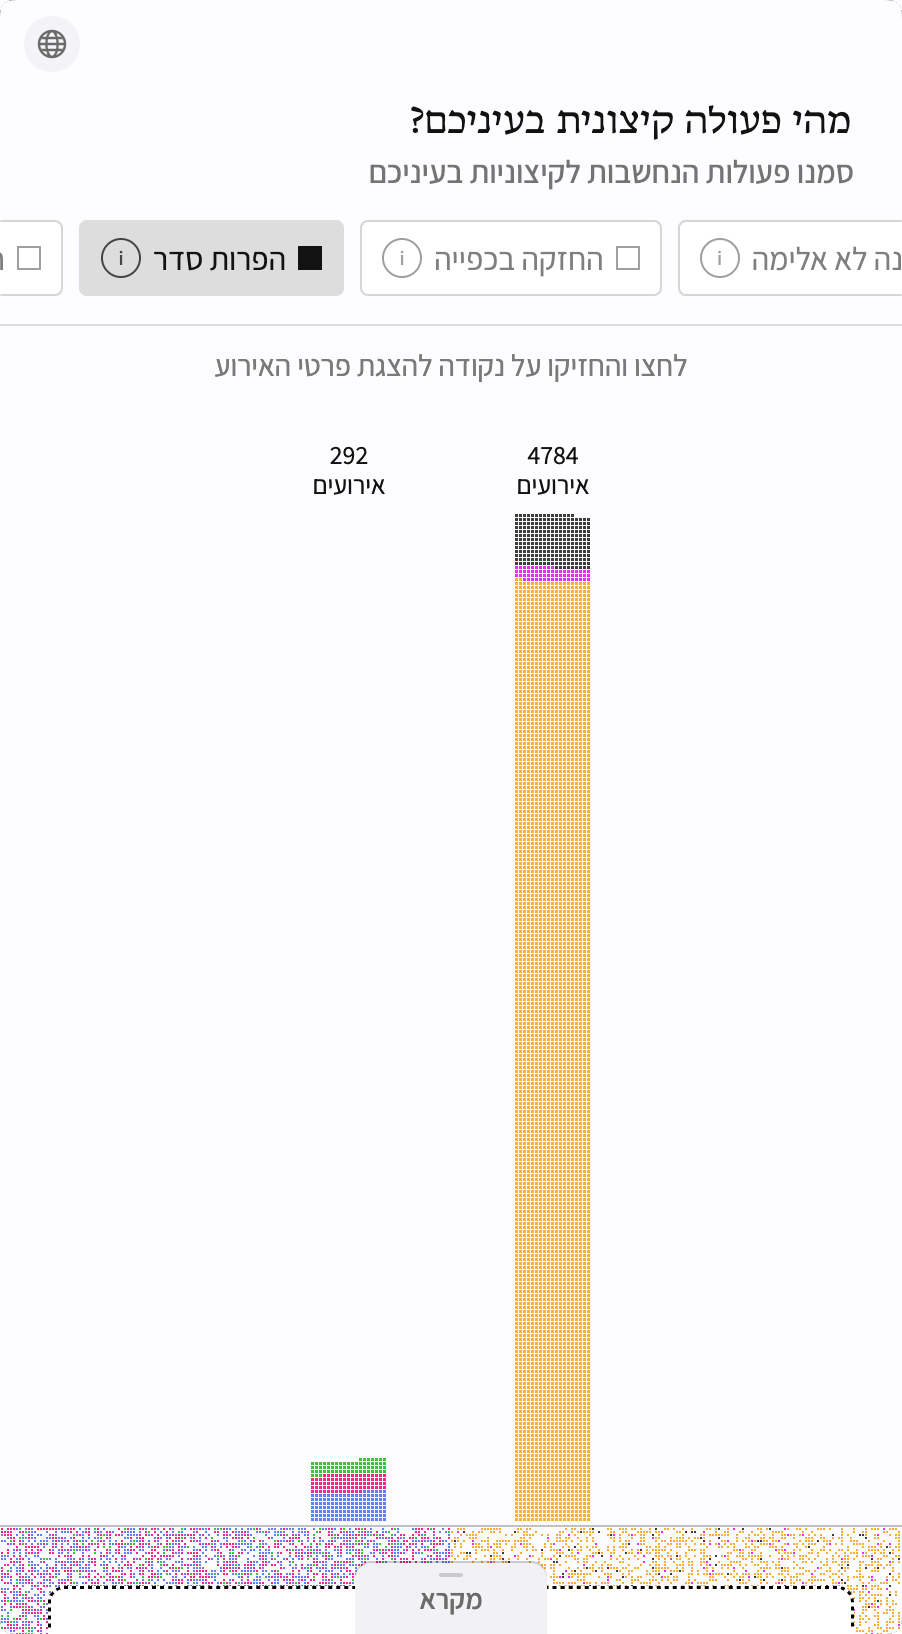
With each type of action selected, the squares representing the relevant events float up from the bottom of the screen and form two columns, one for each camp. When actions such as assaults and pogroms are selected, the gap grows before your eyes: thousands of squares on the right, compared with tens or hundreds on the left. This is the project’s visual and conceptual climax: users see what happens when their own definition of extremism is applied equally to both camps.
Looking more closely at individual events, the violent descriptions stand in tension with the sterile white background and neatly arranged squares. What looks from a distance like just another unit in a chart reveals itself up close as a real event in which people caused or suffered harm.


Adapting to Mobile
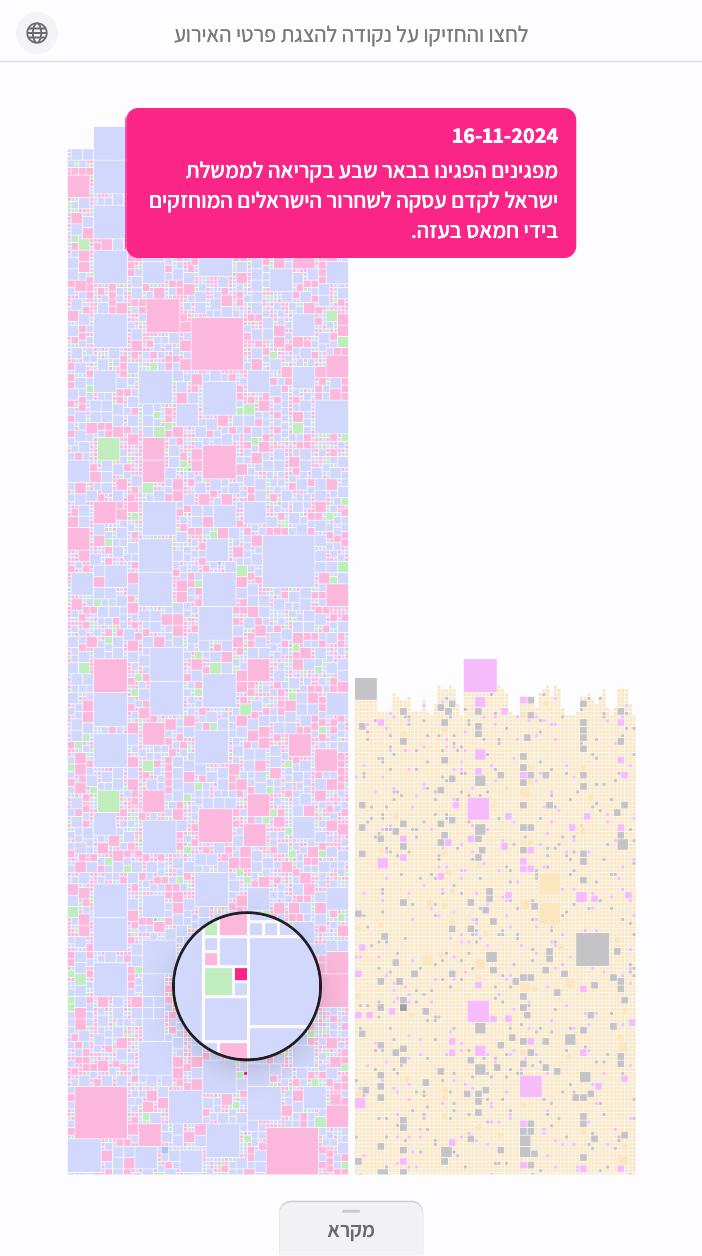
On mobile, the narrow screen made it difficult to preserve the central gap and the comparison between the camps. The interactions were also adapted for touch: hovering became a long press, and the legend moved to the bottom of the screen. I knew many readers would arrive through a WhatsApp link, so the mobile experience needed to be as good as the desktop version.
Early Draft Comparison
Early drafts next to the finished screens. Drag the handle to compare.
Collecting and Classifying the Data
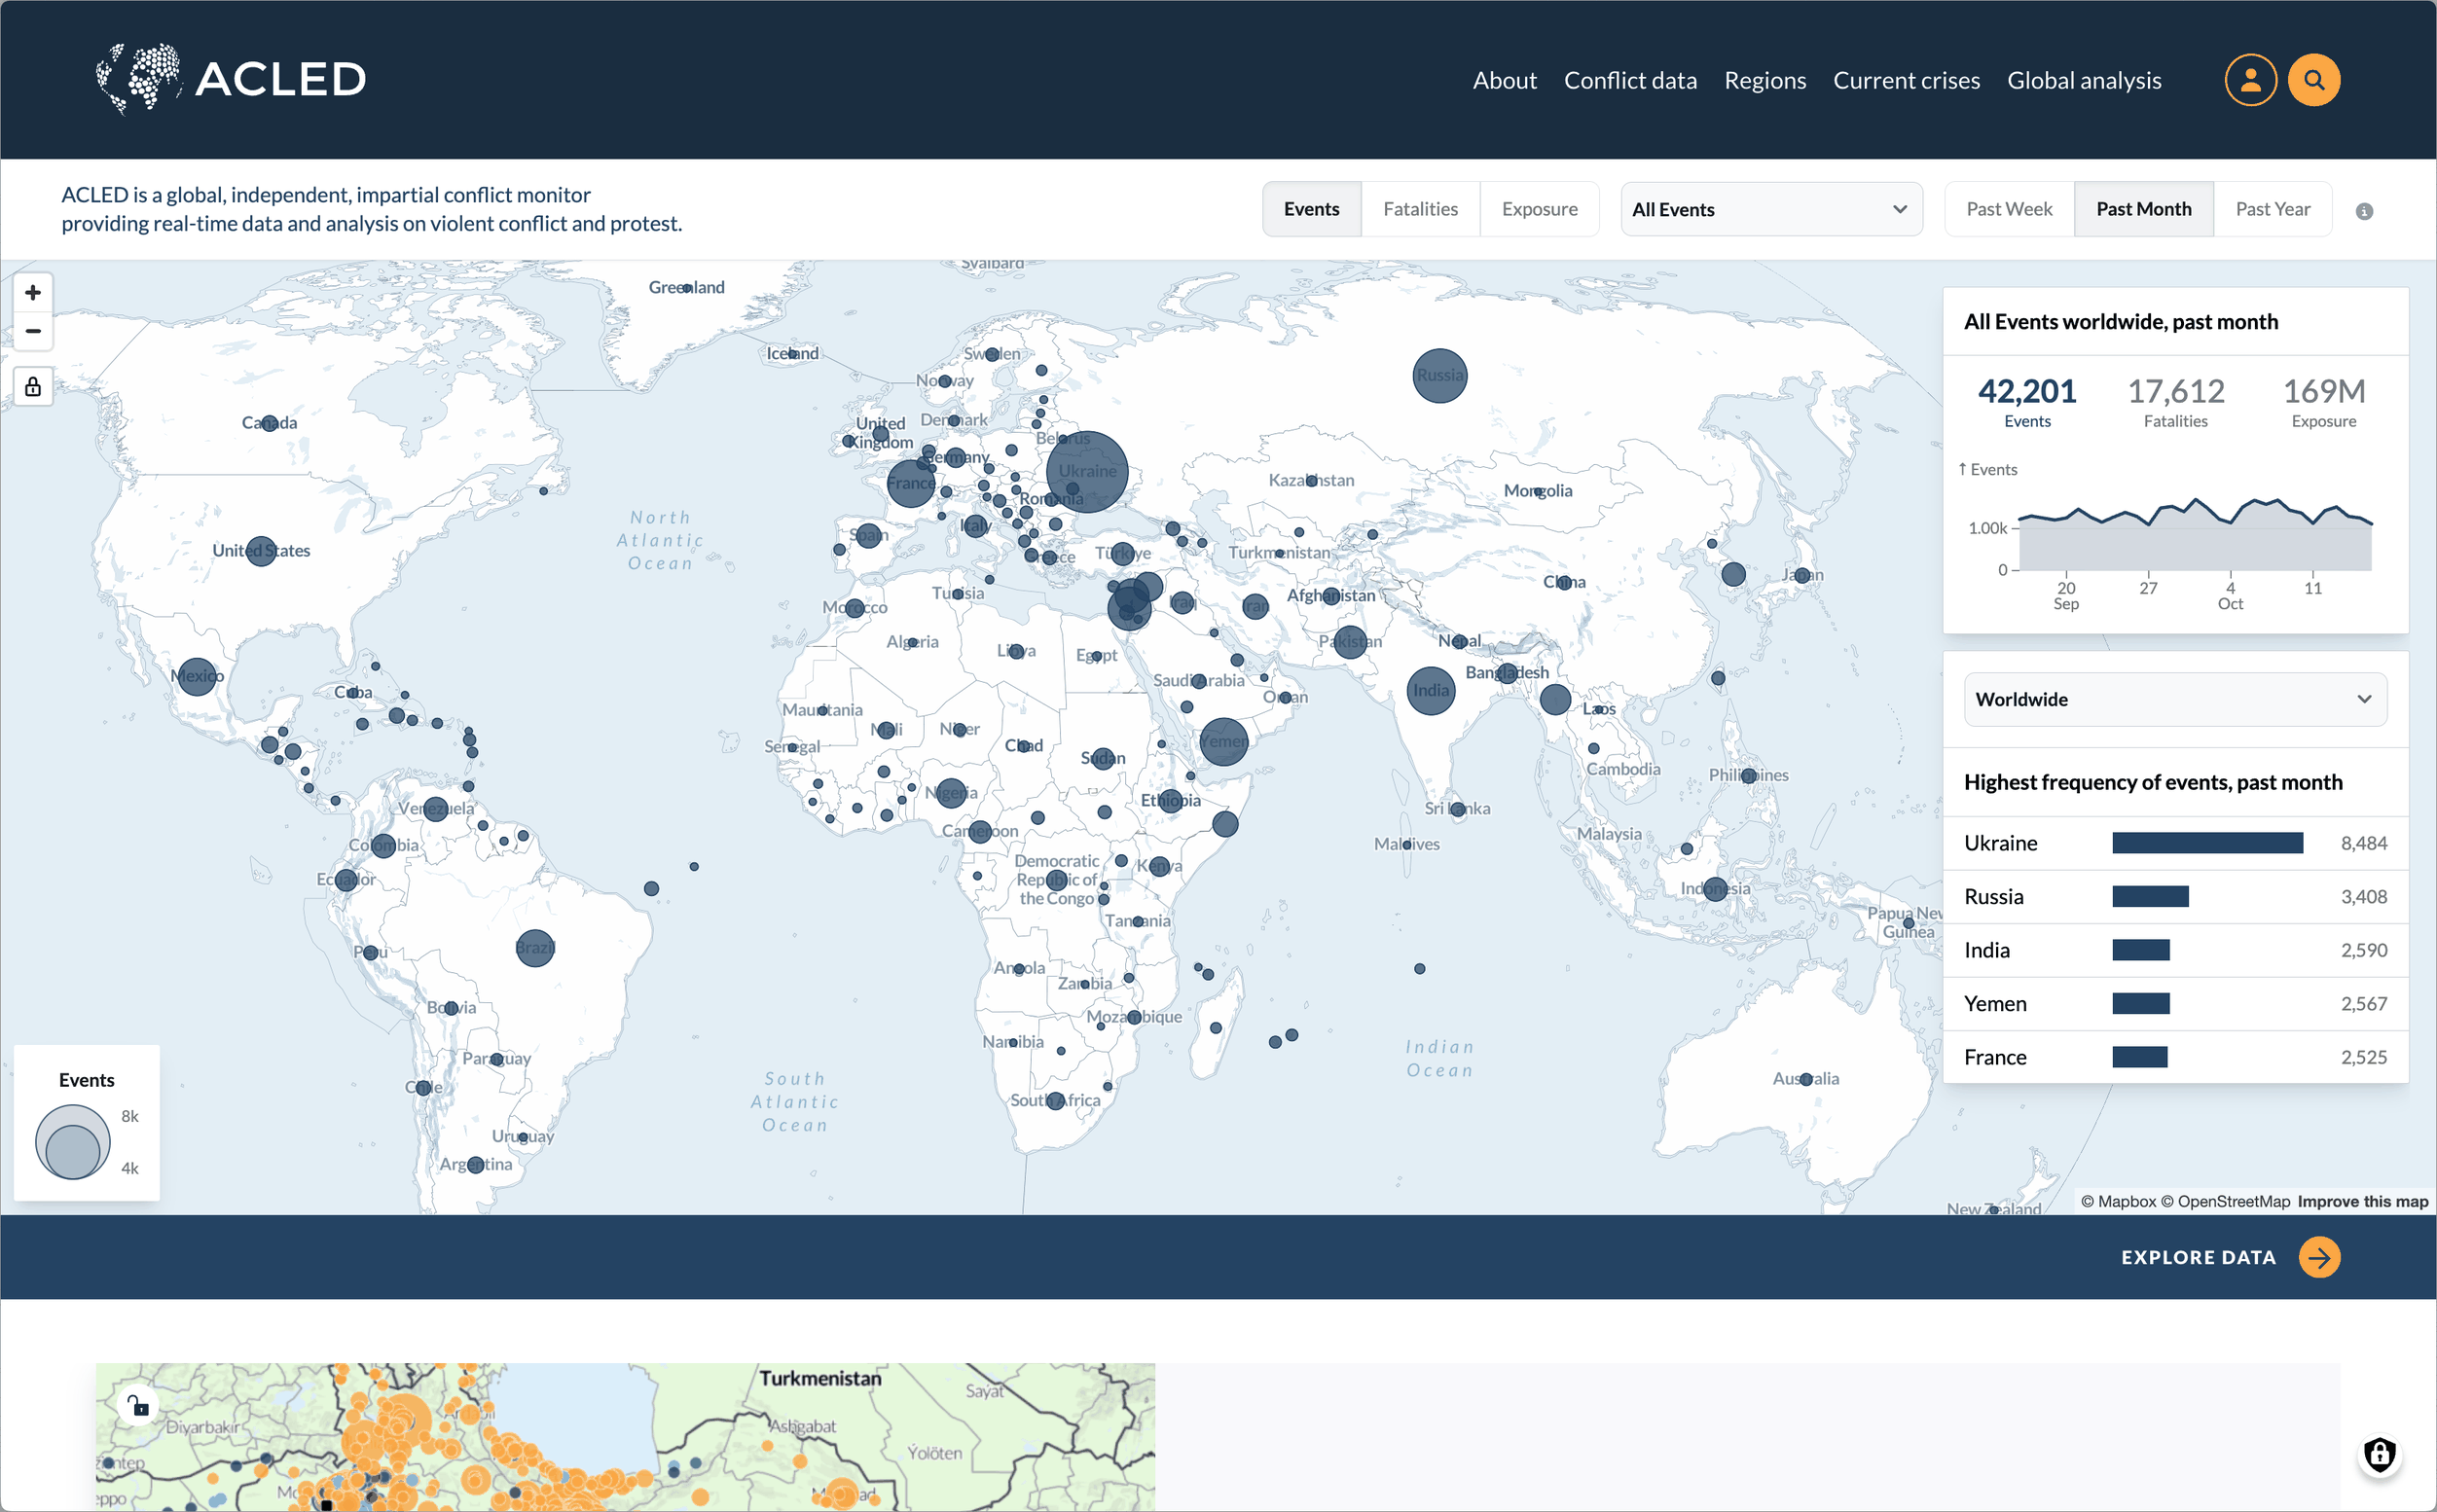
Although this began as a design school project, and I’m not a data analyst, I felt it needed real data to support a meaningful comparison. My search led me to ACLED, a database documenting protests and political violence worldwide. There, I found thousands of events in Israel and the territories. I used only each event’s description and date, extracting the remaining information needed for the project from the description.
I wanted to classify all 13,000 events by the type of action involved. My first attempts involved uploading the entire spreadsheet to ChatGPT with detailed instructions, but the classifications were unreliable. I then switched to the OpenAI API and set up a process that analyzed each event separately using the same instructions. The results were much better.
Reviewing the classifications revealed gaps in my instructions. I had defined damage to objects as property damage, so throwing stones at moving cars fell into that category, even though I considered it a cold-weapon attack. Throwing eggs was also classified as a cold-weapon attack, while incidents involving more than two attackers became pogroms. I continued identifying patterns, refining the instructions, and checking the results, gradually improving the accuracy of the classifications.